
Project prioritisation matrix templates score options nobody has decided on yet. Two thirds of the operating budget is usually locked before the first matrix opens. Three missing columns fix that: what the winner costs, whose assumption set the weights, and what would reopen the ranking.
A program director I worked with a few years ago opened her annual portfolio review with a question she thought was routine: how much of this year's operating budget is available for new work? The answer was 32 per cent. Last year's approved projects, every one of which had scored well on the project prioritisation matrix, now consumed 68 per cent of the operating budget in maintenance and support.
The matrix had ranked the projects correctly. It simply had not scored the thing that happened after each project launched: the cost of keeping it alive.
I have watched this pattern across forty years of work with program leaders and governing boards in government and in industry. The scoring round generates energy and visible outputs (a ranked list, a slide for the board). The support costs accumulate quietly, a year later, in a budget line nobody maps back to the matrix that approved the work.
A project prioritisation matrix is a scoring tool that ranks proposed projects against weighted criteria so a leadership team can compare competing initiatives on one scale.
Why a project prioritisation matrix overrates new work
Every project that a prioritisation matrix approves becomes a line in next year's operating budget. Gartner's research across enterprise IT portfolios found that maintaining existing systems (what Gartner calls "Run") consumes an average of 66 per cent of the IT budget, with incremental improvements and new capabilities splitting the remaining third roughly equally. Deloitte's CIO survey found a similar split: 57 per cent operations, 26 per cent change, 16 per cent innovation. The precise numbers vary by industry; the structural fact does not. Roughly two-thirds of the budget is already committed before the first new project is scored.
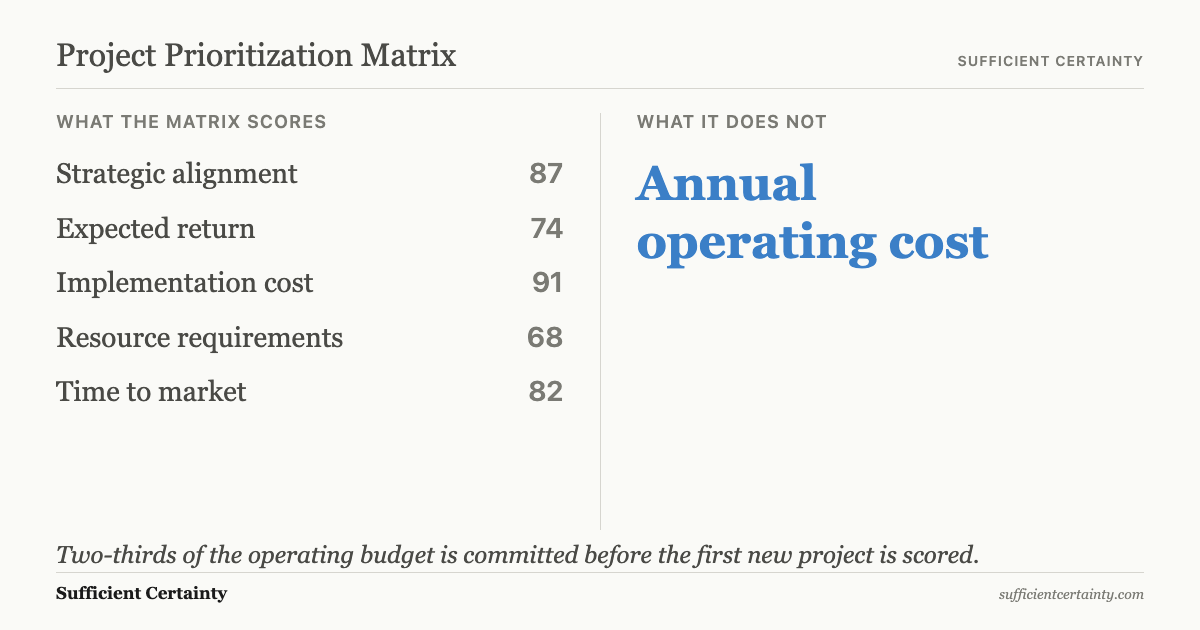
I have sat in scoring meetings where the operating budget was treated as somebody else's problem. A project scores 87 out of 100 on strategic value and return on investment, and the support cost that will compress every budget line behind it appears nowhere in the comparison.
The failure is in what the scoring includes. The weight given to each criterion shapes the ranking before a single score is entered, but operating cost is rarely a criterion at all. If the matrix scores acquisition cost but not annual operating cost, it favours projects that are cheap to launch and expensive to keep.
What the salary comparison leaves out
I once worked with a restaurant owner who faced exactly this at a smaller scale. He needed a second chef because the evening service was overstretching the head chef, who was also the owner's only quality-control mechanism for a restaurant that depended on repeat customers. The cheaper candidate, an assistant chef, met the minimum skill threshold and cost significantly less in salary.
On any scoring matrix the assistant chef would have ranked higher: lower cost and adequate skill. The problem was that the cheaper hire required the owner's direct supervision to maintain food standards, and that supervision consumed his most scarce resource without appearing anywhere in the comparison.
When the monitoring burden was included, the apparently cheaper hire was more expensive. The cost of making the option work belonged inside the decision from the start, not in a separate line of the monthly accounts that the owner would discover three months later.
Roger Estall and I described this in Deciding as the secondary elements of a decision: everything that must be in place for the primary option to deliver its intended outcome. When a prioritisation matrix puts launch cost in one column and support cost in another spreadsheet (or in no spreadsheet at all), the ranking looks rigorous and the budget falls apart twelve months later.
The same pattern, scaled to national programs, produces consequences that take decades to surface. The F-35 Joint Strike Fighter program was approved on the strength of its acquisition cost and capability score. Two decades later, the US Government Accountability Office reported in 2023 that sustainment costs now represent 76 per cent of total lifecycle cost.
The Air Force had estimated per-unit annual operating costs at $4.1 million; actual costs run approximately $7.1 million, a 73 per cent underestimate. Total lifecycle sustainment is projected at between $1.3 and $1.58 trillion against approximately $400 billion in acquisition costs. That is what happens when a scoring grid treats sustainment as someone else's budget.
The UK's Universal Credit IT program followed the same trajectory. The business case projected digital running costs at £571 million. By 2024, actual running costs had reached £857 million, a 50 per cent overrun. The National Audit Office attributed the increase to processes that were "not as automated as anticipated."
The program's identity verification system achieved 38 per cent automation against a 90 per cent target. Universal Credit was prioritised in part because digital self-service was expected to reduce running costs; the scoring treated that expectation as a fact. That is the cost of building a business case on an automation target the system missed by 52 percentage points.
Add the three missing columns to your project matrix and test whether the winner changes when support costs count. Start the Walk →
What a project prioritisation matrix must include before the ranking means anything
A project and the support needed to deliver it require different criteria, not more criteria, because they are parts of the same decision. In the Universal Decision-Making Method, these are primary and secondary elements: the option you choose and the conditions it depends on to deliver its intended outcome. A scoring grid that puts them into different budget cycles has broken the decision in half and ranked only one piece.
In my experience, the people who design the scoring model rarely carry the support costs. The program office that built the matrix moves on to next year's scoring round; the vendor who supplied the methodology moves on to the next bid. The operations team that inherits the running costs was not in the room when the matrix was being filled in. That is a structural bias, not a personality flaw; the annual budgeting cycle funds new work and treats maintenance as a given, so the matrix rewards the same behaviour the budget already incentivises.
When I work with program leaders on portfolios of 15 or 20 proposed projects, the matrix almost never has the columns it needs. The most important is annual operating cost for the first three years after launch, because that is the budget line that compounds across the portfolio. The second is the existing capacity each project will consume once live (including staff time and management attention currently allocated to keeping other systems running). Each cost estimate should also name the assumption it rests on, stated plainly enough that someone can check it twelve months later.
A portfolio of four proposed projects, scored with all five columns, changes the conversation:
| Project | Score | Operating cost | Capacity | Key assumption |
|---|---|---|---|---|
| CRM migration | 87 | $680K/yr | 2.4 FTE | Vendor maintains API at current SLA |
| AI routing | 91 | $310K/yr | 0.8 FTE | Model accuracy holds above 88% |
| Warehouse automation | 78 | $190K/yr | 0.3 FTE | Volume above 12K units/month |
| Legacy decommission | 62 | Saves $420K/yr | Frees 1.2 FTE | Data migration completes by Q3 |
The legacy decommission ranked last on the standard matrix. When operating cost and capacity are visible, it is the only project that makes room for what comes next.
McKinsey's 2026 analysis of enterprise technology budgets found that AI initiatives are consuming up to a third of organisations' change budgets while simultaneously adding to ongoing run costs through compute, model maintenance and data pipelines. The organisations they labelled "deliberate modernisers" managed to keep their run budgets 20 per cent lower than peers by actively decommissioning legacy systems as new ones launched, scoring the retirement alongside the arrival.
I have seen the same principle operate in far less sophisticated settings: a program board that retires one system for every system it approves will have a structurally different budget within two years. The same structural gap appears in lighter-weight scoring models; RICE prioritisation grades Reach, Impact, Confidence and Effort, but none of those four dimensions captures what a feature will cost to maintain once it ships.
That is the operational difference between a project prioritisation matrix that produces a ranking and one that produces a decision the budget can sustain. The ranking tells you which project scored highest. The decision tells you which project you can afford to run and what you must retire to make room for it.
Why the ranking goes stale before the next review
A project ranked second in January can become the first priority by April if the assumptions behind the leading project have changed. A manufacturer committing resources to a new product line depends on assumptions about market demand and competitive conditions that may not hold over the life of the project. The matrix captures a snapshot; it does not capture the rate at which that snapshot decays.
That is why the method places monitoring inside the decision rather than after it. The person making the decision has the greatest awareness of the assumptions that support the ranking, and the quality of that awareness deteriorates rapidly once the decision is implemented and the team's attention moves to the next project in the pipeline.
The best moment to specify what to watch and what would trigger a re-ranking is the moment those assumptions are still fresh. Waiting twelve months for the next portfolio review means governing by assumptions that may already be wrong.
I have seen program offices treat the annual portfolio review as if it were a fresh scoring exercise, when in fact it is a review of whether last year's assumptions still hold. That distinction matters because it determines what the meeting is actually doing.
If the matrix is rescored from scratch every year, the operating costs of approved projects disappear from the comparison because they have been absorbed into the baseline. A project launched eighteen months ago that is now costing 40 per cent more than its approved estimate does not appear in the new scoring round as a problem; it appears as a fixed cost that the CFO has already accepted.
The structural bias toward new work reasserts itself, and the program director discovers, once again, that two-thirds of the budget is spoken for. When the portfolio produces rankings that leadership routinely overrides, the organisation has competing priorities it has not yet resolved, not a scoring problem it can fix with a better spreadsheet.
For a project prioritisation matrix to inform the decision rather than ratify what the budget cycle already rewards, each approved project must carry the assumptions behind its scores and a trigger for reopening the ranking when those assumptions change. Without those, the grid produces a number that looks precise and a portfolio whose assumptions have changed without anyone checking whether the ranking still holds.
You could approve the next project and never score what it costs to run.
Work through your decisionNo sign-up. Just pick your decision and start.
Grant Purdy is the co-author, with Roger Estall, of Deciding (2020), and the architect of the Universal Decision-Making Method.