
A head of product I worked with brought me into a quarterly planning review because two features had come out tied. Her team had scored thirty items using RICE. Everything looked settled until a board member asked: "You scored that feature at 80% confidence. How do you know it is not 50%?" The room went quiet.
I have seen this exchange in different forms for forty years. The framework changes, the problem does not. RICE prioritization fails at the confidence score: a number picked by feel, with nothing to check it against and no way to test it afterwards. That is not a measurement but a preference dressed in arithmetic.
RICE prioritization is a product management scoring model that ranks features by multiplying Reach, Impact, Confidence, and Effort. The confidence score, a self-reported percentage typically set at 100%, 80%, or 50%, acts as a multiplier but has no external standard to check it against.
Where RICE prioritization goes wrong
Sean McBride introduced the RICE framework at Intercom in 2018. Confidence was the safety valve: "100% is high confidence, 80% is medium, 50% is low. Anything below that is a total moonshot." He acknowledged the scoring "may seem unscientific" and moved on.
The entire product management industry then adopted the part McBride himself called unscientific and treated it as a measurement. The original post does not discuss what happens when you check those percentages against reality. McBride asked a reasonable question: how confident are you? I would have asked a different one: confident relative to what? Without a feedback loop telling the scorer whether their past confidence ratings were accurate, the question has no honest answer.
Reach can be checked against analytics after launch. Impact can be checked against experiment results. Effort can be checked against actuals once the work ships. Confidence checks against nothing, because nobody goes back six months later to ask whether the feature scored at 80% deserved that label.
It is the only variable in the RICE formula with nothing to calibrate it against, and it is the one that swings the final score hardest when two features are close. A feature scored at 80% confidence produces a RICE score 60% higher than the same feature scored at 50%. That gap is large enough to reorder a roadmap, and the number that produced it was chosen in forty-five seconds.
What the calibration research actually shows
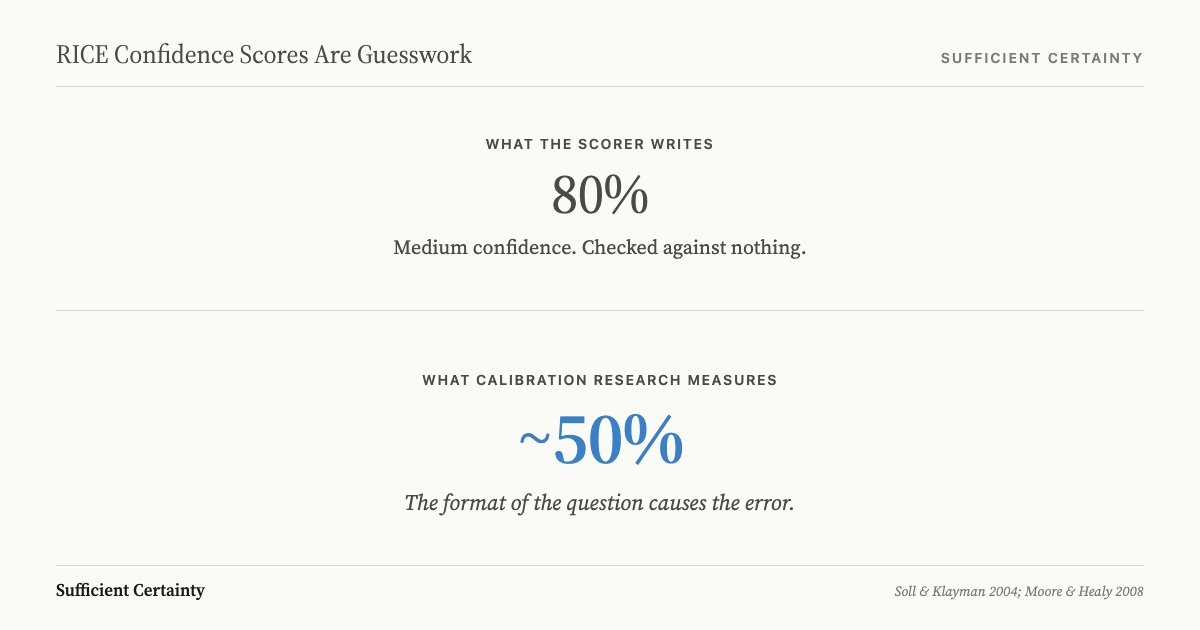
When researchers ask people to provide 80% confidence intervals, ranges they believe will contain the correct answer eighty times out of a hundred, the correct answer falls inside those intervals only about 48% of the time. Soll and Klayman established this in a 2004 study published in the Journal of Experimental Psychology, and their intervals were sometimes only 40% as wide as they needed to be for proper calibration. So an 80% confidence score means you are right about half the time. That is a coin toss with a label on it.
Moore and Healy, writing in Psychological Review in 2008, named this failure mode overprecision: excessive certainty in the accuracy of your own beliefs, visible as confidence intervals that are far too narrow. Overprecision is the most persistent of the three types of overconfidence and the hardest to fix, because the feedback that would correct it never arrives: nobody audits last quarter's scores against what actually shipped.
Haran, Moore, and Morewedge confirmed the pattern in 2010: when participants set 90% confidence intervals, the true value fell inside only 73.79% of the time, and the gap narrowed only when the question format was changed entirely. The format of the question determines how wrong the answer will be, and RICE uses the format that produces the largest errors.
Name the assumption behind the feature you scored at 80% and test whether last quarter's estimates matched what shipped. Start the Walk →
The elicitation method changes the decision
Suppose the problem were only about individual bias; you could argue that averaging across a team would cancel it out. The instability runs deeper than any one scorer's tendencies.
Bottomley, Doyle, and Green tested two seemingly equivalent ways of assigning importance weights, direct rating and point allocation, in a 2000 study in the Journal of Marketing Research. In test-retest, the same alternative would be chosen 88% of the time with one method and only 74% with the other. The methods "may seem to be minor variants of each other, yet they produce very different profiles of attribute weights when rank ordered from most to least important."
RICE confidence is assigned by direct rating: pick 100%, 80%, or 50%. Fischer, writing in Organizational Behavior and Human Decision Processes in 1995, found that direct importance weighting produces a Range Sensitivity Index of 0.12 against a normative requirement of 1.0. The weight vectors barely respond to actual differences in attribute importance; the number you write down tracks the procedure, not the thing you are trying to measure.
Change the procedure, and you change the roadmap, even though nothing about the features or the market has moved. We made this case in Deciding: treating a model's output as the decision itself is the foundational error. A prioritization matrix that multiplies four uncertain inputs compounds their errors rather than cancelling them.
Why practitioners are catching on
The critique is no longer confined to decision science journals. Jeff Meyer at Airfocus put it plainly in 2026: "Put four uncertain numbers into an equation, and the result looks precise, but the precision is inherited from the estimate quality, not the formula." He warns that a roadmap built on dozens of uncertain estimates, each presented with two-decimal precision, compounds the risk rather than reducing it. Janna Bastow at ProdPad went further, arguing that scoring models enable "prioritization theater" where teams game the system rather than clarify priorities. The math, she wrote, "hides uncertainty instead of surfacing it."
These are not academics criticising product management from outside; they build the tools product managers use. When the people who make prioritization software tell you the scores are measuring the wrong thing, the next question is what the scores are actually capturing. The problem they identify is the one the Universal Decision-Making Method was built to solve: decisions that look rigorous because they have a formula, but rest on assumptions nobody has named or tested.
What to do when RICE prioritization doesn't work
The fix is not a better scale. Moving from three bins to five, or from percentages to T-shirt sizes, does not address the structural problem, which is that RICE asks "how confident are you?" when it should ask "what are you assuming when you say 80%?"
Before the score picks the roadmap, I would test the inputs. Start with the Reach estimate: what specific assumption sits behind it, and does next quarter's traffic depend on the same conditions as last quarter's? Then ask what would have to be true for the Impact score to be wrong by half, because if nobody can answer that question, the Impact score is a wish and not an estimate.
The Effort question is simpler but usually the most revealing: which estimate carries the most uncertainty, and where does that uncertainty come from? These three questions force the conversation from "how sure do we feel" to "what are we actually relying on," which is where useful disagreement becomes possible.
Then test the track record: has anyone on this team shipped a feature with this profile before, and what actually happened to the numbers they predicted? If this feature fails, what was the assumption that broke? These questions surface whether the team's past confidence ratings bore any relationship to outcomes, without requiring a calibration study or a statistics degree.
In practice this means the confidence column in your RICE spreadsheet becomes a link to a short assumption register rather than a number. Each row records the assumption, the evidence for it, and the condition under which it would fail.
A feature whose assumptions are well supported and clearly stated does not need a confidence percentage; a feature whose assumptions are untested and contradicted by the last two quarters of data does not need a lower percentage but someone willing to decide whether to investigate or drop it before the sprint begins.
That is what the third step of the Universal Decision-Making Method, Recognise assumptions, exists to do: surface the reasoning underneath the score so that the people who will live with the consequences can see what they are actually committing to and can challenge the weights rather than the final number.
The head of product whose board member asked that question did not need a better confidence scale. She needed the conversation that the score was designed to replace. RICE prioritization fails because the confidence score asks a question that human cognition reliably answers incorrectly, and the three-point scale cannot fix what is structural.
But the deeper failure is organisational: the score exists because the conversation is harder, and most teams would rather have a number they cannot defend than a debate they cannot control. I have yet to see a team that named its assumptions and still needed the percentage.
You could score the next feature at 80% confidence and never learn whether that meant anything.
Work through your decisionNo sign-up. Just pick your decision and start.
Grant Purdy is the co-author, with Roger Estall, of Deciding (2020), and the architect of the Universal Decision-Making Method.