
A few years ago I reviewed a strategy map for a listed infrastructure company. Fourteen objectives across the four perspectives, twenty-three arrows connecting them, not one note recording what any arrow assumed. The facilitator was paid, the map was filed, and every connection was presented to the board as validated cause and effect. That is a typical strategy map example: a diagram where every arrow is treated as proven, with the assumptions behind every connection invisible.
That map looked finished. It was a set of untested beliefs drawn in boxes.
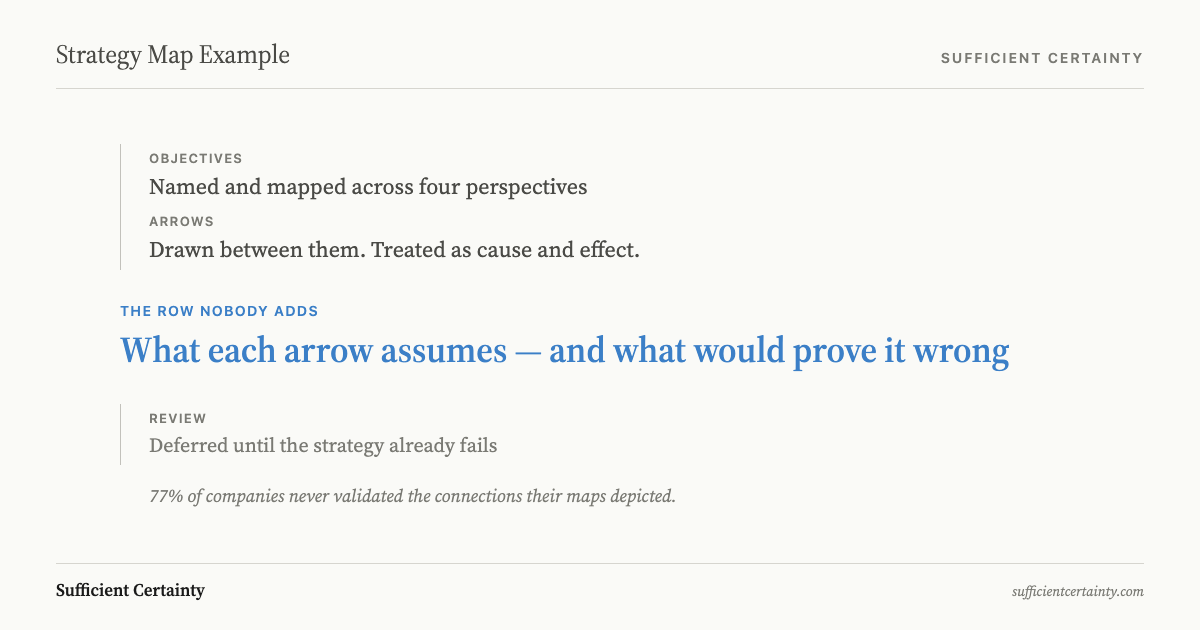
Ittner and Larcker studied over sixty companies using balanced scorecards and strategy maps. They found that 77 per cent had never validated the causal connections their maps depicted. The arrows are untested beliefs about what leads to what, drawn once and never revisited.
A strategy map is a one-page diagram arranging objectives across four perspectives with arrows showing how lower-level objectives drive higher-level outcomes.
Every arrow on a strategy map is a hypothesis
Robert Kaplan and David Norton, who formalised the strategy map in 2004, described each arrow as a "testable hypothesis." Each arrow asserts that investing at one level produces results at the next. The visual clarity makes the story look proven.
Hanne Norreklit demonstrated that most strategy map arrows do not represent genuine causation. Customer satisfaction does not cause financial performance the way heating water causes steam. The relationship is contingent and context-dependent.
Norreklit's term for what the arrows depict is finality: one objective is a means to an end, not a proven cause of it. A causal claim invites testing. A finality claim tends to be accepted as self-evident. I have presented that distinction to boards. The usual response is a brief silence, then a return to the diagram.
The methodology provides no mechanism for identifying which arrows rest on breakable assumptions and no trigger for revisiting the map when they break. The KPIs chosen for each objective report what happened last quarter. They do not test whether the causal connection to the next objective still holds.
Strategy map example: a taxi company before disruption
Consider the taxi industry before ride-sharing arrived. A taxi company's strategy map would have shown four connected objectives:
Financial: Protect margin through controlled pricing.
Customer: Sustain captive demand from passengers with no alternative.
Internal Process: Control fleet supply within the licensed pool.
Learning and Growth: Maintain regulatory taxi licence.
Every arrow would have appeared causal. The chain held for decades. Beneath those arrows sat two assumptions that nobody had written down.
The first: the regulatory barrier to entry would persist indefinitely. The second: customers valued availability within the existing supply constraint, rather than a level of convenience the regulated model had never permitted.
When Uber began matching riders to unlicensed drivers through a phone application, both assumptions broke simultaneously. Every arrow on the strategy map reversed within three years. Market share collapsed. The regulatory licence that had been the strategic foundation became overhead with no protective value.
Companies that had invested in fleet expansion on the assumption that demand was captive found themselves holding depreciating assets in a market that no longer required them. That is what a strategy map without an assumption layer looks like: a diagram that confirms the current strategy right up until the moment the strategy fails.
The same dynamic appears in a worked balanced scorecard example, where a filled-in scorecard reports green on every measure while the assumptions beneath those measures erode unnoticed.
The fix is structural. Beneath each arrow, add a row with two fields: the assumption the arrow rests on, and the tripwire, the observable signal that would tell you the assumption has broken.
Tripwire: unregulated fare falls below regulated minimum
Tripwire: competitor offers transport outside regulated pool
Tripwire: any jurisdiction permits transport without taxi licence
Taxi company strategy map with assumption column beneath each arrow
What a strategy map example produces when tested
The companies that test their strategy map assumptions outperform those that do not. The margin is not trivial.
Ittner and Larcker found that the 23 per cent which verified causal models linking non-financial measures to financial results achieved return on assets 2.95 percentage points higher and return on equity 5.14 percentage points higher than those that measured without validating.
I have sat in rooms where the board nodded at every arrow on the map and nobody asked what would prove one wrong. The 77 per cent figure does not surprise me.
Mankins and Steele, surveying 197 executives at companies with revenue exceeding $500 million, found that companies on average deliver only 63 per cent of the financial performance their strategies promise. Fewer than 15 per cent regularly compared actual results against prior strategic-plan forecasts.
That is how a 37 per cent strategy-to-performance gap persists: the maps point forward, but nobody looks back to check whether the predicted connections materialised.
The fifth step of the Universal Decision-Making Method, design monitoring, exists to close this gap. It requires the decision-maker to name the assumptions that support the decision and specify the conditions under which the decision would need to be reopened, with a named owner responsible for each tripwire.
Strategy map example: a manufacturing company
I have built assumption columns with boards in sectors from infrastructure to financial services. Here is how it works for a manufacturing company with three arrows on its strategy map.
Arrow: "Invest in automation" leads to "Reduce unit cost."
Assumption: Labour costs in this facility will remain above the break-even threshold for the automation investment.
Tripwire: Unit labour cost falls below $14 per unit for two consecutive quarters.
Owner: Operations director.
Arrow: "Reduce unit cost" leads to "Increase gross margin."
Assumption: Raw material prices will stay within the forecast band.
Tripwire: Input cost per unit exceeds $22 for any rolling quarter.
Owner: Procurement lead.
Arrow: "Increase gross margin" leads to "Fund product development."
Assumption: Board will reinvest margin gains rather than distribute them.
Tripwire: Board resolution diverts more than 40 per cent of margin gain to dividends.
Owner: CFO.
That is the practical difference between a metric and a tripwire. A metric reports what happened. A tripwire fires when the assumption behind the metric stops holding, which means the strategy map arrow above it may no longer be valid.
Roger Estall and I addressed this directly in Deciding: "Recording the assumptions as well as the decision itself also allows monitoring for any subsequent change in the circumstances on which the assumptions are based."
In practice, monitoring frequency follows the volatility of the assumption, not a calendar. A stable assumption (our core technology will remain patent-protected) might need annual review. A volatile assumption (commodity input prices will stay within the forecast band) might need weekly checks.
I have never seen a strategy-map software vendor sell the assumption column. Software vendors and the consultants rehired when the strategy fails sell the clean diagram, not the uncomfortable question beneath it. Whichever version of the Kaplan and Norton balanced scorecard an organisation uses, the map that accompanies it should carry its assumptions where they can be seen and monitored.
You could finish the strategy map and never name what would break an arrow.
Work through your decisionNo sign-up. Just pick your decision and start.
Grant Purdy is the co-author, with Roger Estall, of Deciding (2020), and the architect of the Universal Decision-Making Method.