
After a trade study, test the assumptions behind the criteria weights and the performance estimates before committing to the selected alternative. A ranking can be arithmetically sound and still rest on conditions that were only ever tested inside an optimistic range. In the early 1970s, the economic case for the Space Shuttle assumed dozens of flights a year. The fleet never flew more than nine.
A trade study compares alternative designs against weighted criteria such as performance, cost, schedule and risk, and recommends the one that best meets the objectives.
The textbook sequence after a trade study
The process is well documented. The NASA Systems Engineering Handbook describes it in four moves: devise alternatives, evaluate them against measures of performance and life cycle cost, rank them against selection criteria, then drop the weaker options and proceed to the next level of resolution. Most engineering organisations follow a close variant, whether the tool is a weighted scoring model, a Pugh matrix or a full utility analysis.
The output is a trade study report. The handbook lists what it should contain: the goals and constraints, the models and data sources, the alternatives, computational results "including uncertainty ranges and sensitivity analyses performed", the selection rule and the recommended alternative. The report then goes to a design review or a decision authority for acceptance.
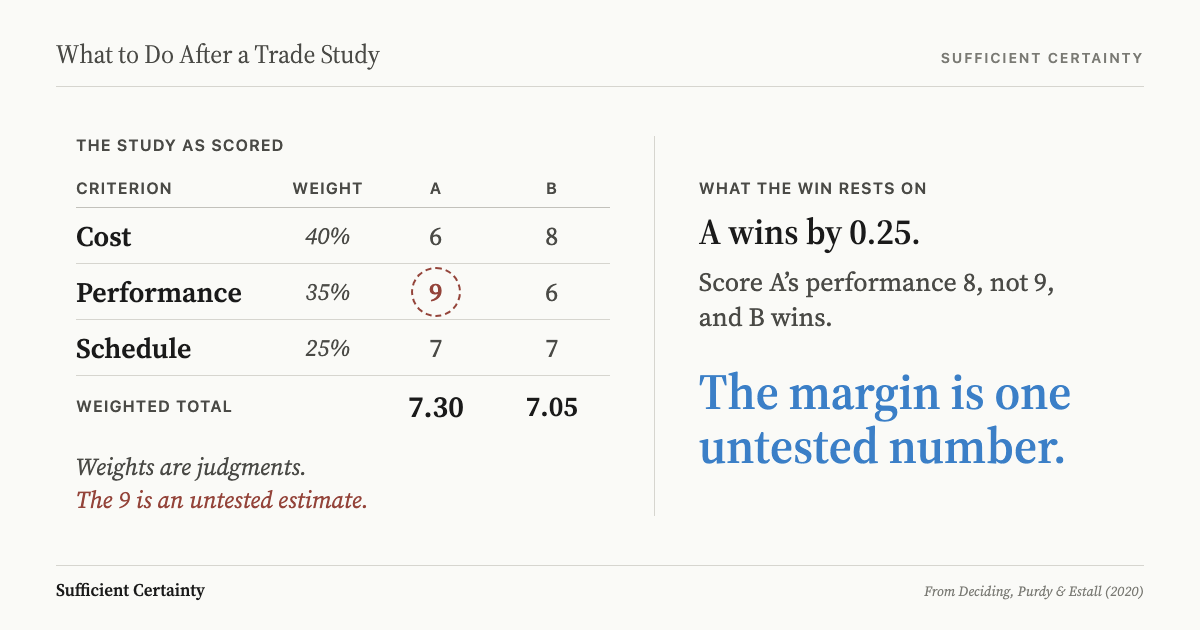
Once the recommendation is accepted, the selected alternative becomes the baseline. Requirements flow down from it, suppliers are engaged and budgets are built on its cost estimate. The losing options are archived. Any further trade-off analysis happens inside the chosen architecture, not between architectures.
From that point, the trade study is no longer treated as an analysis. It is treated as the answer. Later questions assume the selection was right and ask only how to deliver it.
The value in that sequence
The discipline is worth having. A trade study forces a team to put competing options on the same scale before money is spent on any of them. Without it, the loudest advocate or the most familiar design tends to win by default.
It also makes preferences visible. Writing down criteria and weights exposes disagreements that would otherwise surface late, in a design review or a cost overrun. The handbook notes that subjectivity "plays a significant role" even when quantitative techniques are used, and asks that trade study assumptions, models and results be kept in the project archives. That record lets a later review reconstruct why one design beat another.
The method also scales. The same logic that selects a launch architecture selects a pump, a software platform or a supplier. It sits comfortably among the decision-making frameworks that engineering and operations teams already trust, and it produces an auditable document a sponsor can sign.
The weakness is not in the method. It lies in what the method is allowed to hold constant.
The structural blind spot
Every trade study rests on three kinds of input, and each carries an assumption the ranking cannot test.
The first is the criteria weights. They record what mattered to the decision makers at the time, usually shaped by the tightest constraint in front of them. If this year's development budget is the binding constraint, it gets a heavy weight. Whether that weighting still fits a decision with a twenty-year operating life is a question the matrix never asks.
The second is the performance estimates. Unit cost, reliability and turnaround time are predictions, but once they are entered as scores they read like measurements. Triantaphyllou and Sánchez (1997) treat both the criteria weights and the performance values as imprecise, changeable inputs that need sensitivity testing. Most trade study reports present them as settled.
The third is the least visible. Some assumptions are shared by every alternative: the demand forecast, the operating tempo, the mission model. Because they apply equally to all options, they rarely decide the ranking, and when they are varied, the range is drawn around the same forecast. A sensitivity test bounded by the shared assumption cannot show what happens if the assumption itself is wrong.
Sensitivity analysis helps with the first two when the ranges are honest, though it varies inputs inside the model rather than questioning the model's premises. The same gap appears after multi-criteria decision analysis. A trade study answers which alternative is best under a set of conditions. It does not answer whether those conditions will hold.
Write down the criterion weight your winning alternative depends on most and ask who tested it before the scores closed the choice. Start the Walk →
How NASA learned this
At the start of the 1970s, NASA needed an economic case for a reusable Space Shuttle. The overall economic evaluation went to Mathematica, the Princeton firm founded by the economist Oskar Morgenstern, where Klaus Heiss led the Shuttle studies. NASA's official history, The Space Shuttle Decision by T.A. Heppenheimer, records the numbers the analysis worked from.
The baseline mission model called for 736 Shuttle flights between 1978 and 1990, some 57 a year. Mathematica's main report, completed on 31 May 1971, found that a Shuttle with $12.8 billion in nonrecurring costs would pay for itself at 506 flights over the same period, or 39 a year.
Then the budget tightened, and the trade shifted to how much cost per flight NASA could accept in exchange for a cheaper development. In a memo to Administrator James Fletcher dated 28 October 1971, Heiss and Morgenstern argued for a partially reusable design with an external tank and strap-on boosters. They estimated it would cut nonrecurring costs from about $9 billion to about $6 billion "with a minimal operating cost increase, if any."
Heiss judged that even at $10 million per flight, all but five percent of the planned missions would stay cost-effective against expendable rockets. President Nixon approved the program on 5 January 1972. NASA then chose solid rocket boosters, whose development costs were low and firm, and whose recovery promised a cost per flight of around $10 million. The development estimate came in at $5.15 billion, under the $5.5 billion limit the budget office had set.
| What the Shuttle trade produced | What it assumed | Gap to test |
|---|---|---|
| Criteria weight: development cost decides, within a $5.5 billion limit | The 1971 budget constraint would remain the constraint that mattered over the program's life | Whether operating costs across the full flight life outweigh the development saving |
| Performance estimate: around $10 million per flight | Boosters could be recovered and refurbished quickly and cheaply | What evidence supports the recovery and turnaround figures before they set the baseline |
| Shared scenario: 736 flights from 1978 to 1990, about 57 a year | Demand would arrive at that rate whichever design was chosen | Whether demand anywhere near even the lowest modelled rate would materialise |
Every mission model Mathematica examined, from 500 to 900 flights, assumed dozens of flights a year. The break-even test was real, but it never left that band. The first Shuttle flew in 1981, and nine Shuttle flights were launched in 1985, the busiest year the program had. The fleet completed 135 missions in 30 years.
Pielke and Byerly (2011) put spending on the program at more than $192 billion in 2010 dollars, about $1.5 billion per flight once lifetime costs are included. That average is not directly comparable with a 1972 incremental estimate. The flight rate needs no adjustment. The trade study may well have picked the best design for a flight rate that never arrived.
Testing assumptions before committing resources
The step belongs between the recommendation and the baseline. Before the selected alternative becomes the premise for every later plan, list what the ranking depended on and test the items that would change the decision if they were wrong. The same pattern follows a technical feasibility study, where a go recommendation inherits confidence the technology earned.
The five-step Universal Decision-Making Method puts this work in order. Frame the decision around its purpose, not around the trade study's criteria. Treat the recommended alternative as a tentative element rather than a conclusion. Surface the assumptions under the weights, the estimates and the shared scenario.
Then decide what level of confidence counts as sufficient certainty for a commitment of this size. Implement and monitor the assumptions most likely to drift, starting with demand.
A trade study earns a recommendation. The commitment has to be earned by testing what the recommendation assumed.
You could sign off the winning alternative and still leave the weight that made it win untested.
Work through your decisionNo sign-up. Just pick your decision and start.
Grant Purdy is the co-author, with Roger Estall, of Deciding (2020), and the architect of the Universal Decision-Making Method.