
After sensitivity analysis, most teams rank the critical variables and focus resources on reducing uncertainty around the top-ranked inputs. The step they skip is testing whether the model itself, and the ranges fed into it, rest on assumptions the analysis never examined.
Sensitivity analysis systematically varies input parameters in a model to measure how changes in each input affect the output.
The standard next step after sensitivity analysis
The standard move after sensitivity analysis is to build a response plan around the variables that showed the greatest influence on the output. A tornado diagram identifies which inputs swing the net present value, internal rate of return, or project outcome most. The team takes the top three or four variables and designs interventions: hedging strategies for commodity prices, contract clauses for cost inputs, contingency budgets sized to the range each variable covered.
In capital budgeting, this translates into risk-adjusted discount rates, scenario-specific go/no-go thresholds, and staged investment gates tied to the variables the sensitivity analysis flagged. In engineering and environmental assessment, it means tightening tolerances on high-sensitivity parameters or commissioning additional data collection for the inputs that matter most. The ranking decides where attention and money go, and the ranking is treated as the final word on what matters.
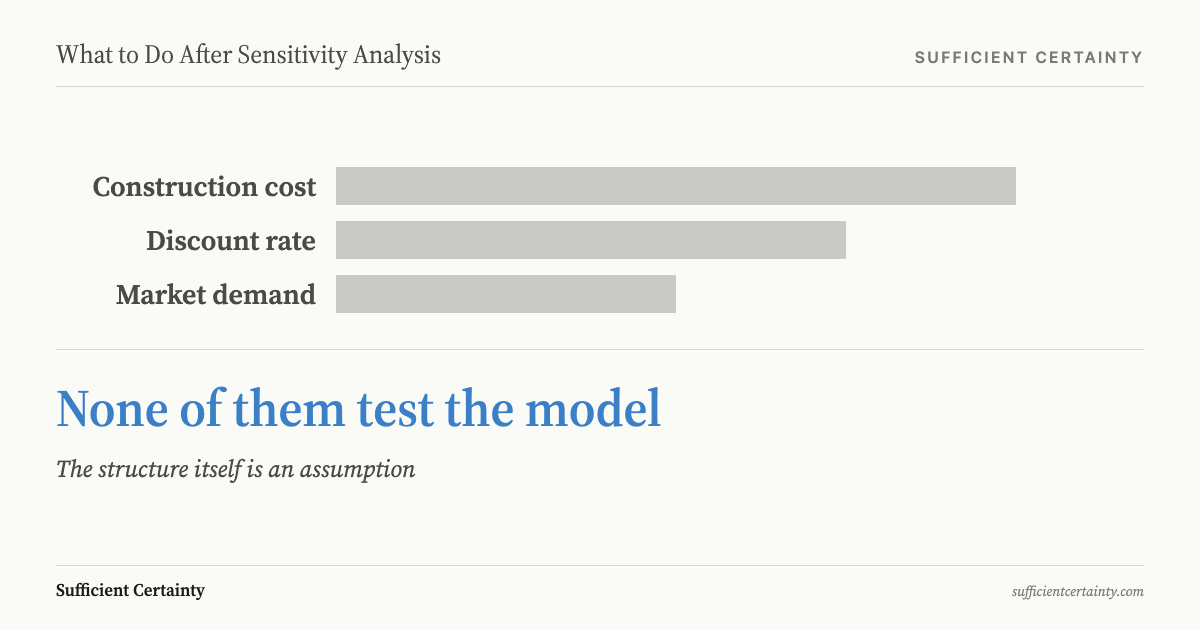
The process typically follows a sequence. Run the sensitivity analysis. Identify the critical variables, those where small changes produce large output swings. Rank them. Assign ownership for monitoring or mitigating each one. Build the project control framework around that ranking.
Borgonovo and Plischke (2016) reviewed advances in sensitivity analysis methods and found growing consensus that global methods, which vary all inputs simultaneously, provide more reliable rankings than one-at-a-time approaches. The methodological conversation is sophisticated. What gets less attention is the set of assumptions beneath the model: the structural form, the independence of the inputs, and the accuracy of the ranges assigned to each variable.
What that step adds
The response plan adds structure. Without sensitivity analysis, resource allocation defaults to intuition, seniority, or whichever variable generated the most recent alarm. The tornado diagram replaces anecdote with measurement. It gives the project team a defensible answer when facing trade-off decisions about where to concentrate limited attention.
The contribution extends beyond ranking. Sensitivity analysis forces modellers to state their inputs explicitly, making every variable visible and every range a testable claim. Pannell (1997) argued that sensitivity analysis in normative economic models serves as much to illuminate the model's structure as to identify critical parameters.
Monte Carlo simulation captures interactions between variables and produces probability distributions rather than point estimates. The project team moves from "the NPV is $12 million" to "the NPV has a 70% probability of falling between $8 million and $18 million." This is a material improvement in quantitative decision-making.
The problem is not that sensitivity analysis fails to deliver value. The problem is that its outputs are treated as conclusions when they are still hypotheses about which variables matter most. The same applies to multi-criteria decision analysis, where a weighted ranking looks like a verdict but rests on the same category of untested input assumptions. Litigation has its own version: the expected value behind a settlement offer gets treated as the answer while the win probability and damages range feeding it go unexamined.
Write down the range your tornado chart's top variable depends on and ask whether anyone tested it or inherited it from the last model. Start the Walk →
Where the standard playbook breaks down
The playbook breaks down at three points that the sensitivity analysis itself cannot address.
First, the ranges. Every sensitivity analysis requires a range for each input variable. Those ranges are assumptions. A cost estimate varied between £15 billion and £20 billion assumes that £20 billion is the plausible upper bound. If the true upper bound is £35 billion, the sensitivity analysis will correctly identify cost as important but will dramatically understate how important.
| What sensitivity analysis produced | What it assumed | Gap to test |
|---|---|---|
| Tornado ranking of critical variables | Input ranges reflect actual uncertainty bounds | Whether the ranges were based on evidence or convention |
| Break-even threshold for the dominant variable | The model structure is correct and complete | Whether a variable omitted from the model matters more than any included one |
| Independence of each variable's contribution | Inputs vary independently of one another | Whether correlated movements change the ranking entirely |
Second, independence. Standard one-at-a-time sensitivity analysis varies each input while holding others constant. This assumes the inputs are independent. In practice, construction time and construction cost are correlated. Interest rates and electricity prices move with the same macroeconomic conditions. A tornado diagram that treats these as separate variables underestimates the combined effect when they move together.
Third, model structure. The sensitivity analysis tests inputs within a model. It does not test the model. If the model omits a relevant variable entirely, or if the functional relationship between inputs and outputs is misspecified, the sensitivity analysis will produce precise answers to the wrong question. Saltelli et al. (2019) found that a majority of published sensitivity analyses omit basic methodological steps, producing rankings that look rigorous but inherit the model's unexamined structure.
Hinkley Point C, the UK nuclear power station being built by EDF, demonstrates all three failures operating simultaneously. The original business case, reviewed by the National Audit Office in 2017, relied on sensitivity analysis of construction costs, discount rates, electricity price forecasts, and the strike price agreed with the UK government. The sensitivity analysis varied each input across ranges drawn from comparable nuclear projects and energy market forecasts.
The ranges proved too narrow. The original cost estimate of approximately £18 billion has grown to a projected £46 billion or more. The strike price of £92.50 per megawatt-hour (in 2012 prices, index-linked) was set on the assumption that wholesale electricity prices would rise, making the guaranteed price look reasonable over time. Wholesale prices fell instead.
Construction time, construction cost, and financing rates, variables treated as separable in the sensitivity analysis, are structurally correlated in large infrastructure projects. These are the kinds of decisions made under uncertainty where the assumptions behind the analysis carry more weight than the analysis itself.
The sensitivity analysis was not badly executed. It tested the inputs it was given, across the ranges it was given, inside the model it was given. The assumptions that determined the ranges, the independence of the variables, and the structure of the model sat outside its scope. The NAO noted that the value-for-money case was "marginal" even under the government's own assumptions and that alternative scenarios showed a substantially different picture.
The step to take first
The response plan is not the problem. The problem is building it before testing the assumptions the sensitivity analysis rests on. Before a tornado ranking enters a project control framework, each finding needs to survive a question: what had to be true for this ranking to hold?
Take each critical variable identified by the sensitivity analysis and rewrite the finding as a claim. "Construction cost is the most sensitive variable" becomes "construction cost, varied between £15 billion and £20 billion, drives the largest output swing, assuming the range is accurate, the relationship is linear, and cost is independent of schedule."
Then test each assumption in that claim. A sensitivity analysis that produced a defensible ranking of variables and rested on ranges nobody verified is a precise answer to an unexamined question.
The five-step structure in the Sufficient Certainty method places assumption recognition before any commitment. Frame the decision. Identify tentative elements. Surface the assumptions embedded in the analysis. Determine whether enough of those assumptions have been verified to proceed with sufficient certainty. Then implement with monitoring in place.
This is not a rejection of sensitivity analysis. It is the step that converts a model-based framework output into evidence a decision maker can rely on.
The variables the sensitivity analysis identified as critical are real findings. The question is whether the conditions under which they were identified as critical are also real.
Testing those conditions before the response plan commits resources is the step that determines whether the plan addresses the actual decision or a model of the decision that was never compared against the world it claims to represent. The sensitivity analysis tells the decision maker which inputs matter most inside the model. Testing the assumptions tells the decision maker whether the model describes the situation well enough to act on.
You could close this tab and carry that decision into another week.
Work through your decisionNo sign-up. Just pick your decision and start.
Grant Purdy is the co-author, with Roger Estall, of Deciding (2020), and the architect of the Universal Decision-Making Method.