
After an FMEA, and before closing out the actions, go through every row where a low detection score relies on a backup safeguard, and check that the safeguard actually works on site. When Shebl, Franklin and Barber (2012) compared two hospital FMEA teams' work with three years of incident reports, nine of the 22 relevant incidents were failure types the teams had not identified. Seven of those nine were omitted doses, the failure most commonly reported in the trust's database.
FMEA (failure mode and effects analysis) lists how each component or process step can fail, what each failure would cause, and how likely and detectable it is.
Working the recommended actions down to the control plan
Scoring is roughly the halfway point of an FMEA. Each failure mode carries three ratings, usually on 1 to 10 scales: severity of the effect, occurrence of the cause, and detection, the chance that current controls catch the failure before it does harm. IEC 60812:2018, the international standard for the method, accepts the classic risk priority number and alternatives to it, including a criticality matrix.
Teams then rank. The traditional ranking multiplies the three scores into a risk priority number (RPN) and works down from the top. The automotive industry's AIAG and VDA FMEA Handbook (2019) replaced the product with Action Priority, a lookup that weights severity first, then occurrence, then detection. Either way, ranking is FMEA's version of risk evaluation.
For each row above the line, the team writes a recommended action, names an owner and sets a date. Actions aim at the cause, to cut occurrence, or at the controls, to improve detection. Severity rarely moves unless the design changes. When the actions are done, the team re-scores the row and records the new numbers beside the old.
The last step links the analysis to production. A design FMEA feeds the process FMEA, and the process FMEA's prevention and detection controls become lines in the control plan, each with a check, a frequency and a reaction plan. The worksheet is then closed and filed as evidence that the risks were dealt with. Where inspection supports a control, the risk-based inspection follow-up checks whether the asset evidence supports its coverage and interval.
When the closed rows are plotted on severity against detection, most land in low-concern cells. A row with a catastrophic effect and a strong detection control sits in the middle of the grid, flagged but not urgent.
| Severity low | Severity high | |
|---|---|---|
| Detection weak | Nuisance failures that slip through. Fix when convenient. | Top of the action list. Where overfill belongs if the switch is unproven. |
| Detection strong | Caught early and cheap. Monitor only. | Tank overfill: S 9, O 3, D 2 Detection rests on the high-level switch. Moves up if the switch is unproven. |
A good FMEA makes a team name every way a part can fail
An FMEA puts designers, operators and maintainers in one room with one drawing and makes them name failure modes one line at a time. It is risk identification at component level, and what a fitter knows from experience gets written down where a design reviewer can see it.
It also leaves a trail. Each score has an author and a date, and each action has an owner. Auditors, customers and regulators can trace why a sensor was added or a tolerance tightened. Among the tools of risk assessment, it is hard to beat for coverage of known components and known process steps.
The scoring helps even though its arithmetic is crude: with three 1 to 10 scales, only 120 of the 1,000 possible products are distinct values. Arguing over whether occurrence is a 3 or a 6 still brings out disagreements about field history, as a risk matrix does when people disagree about a colour.
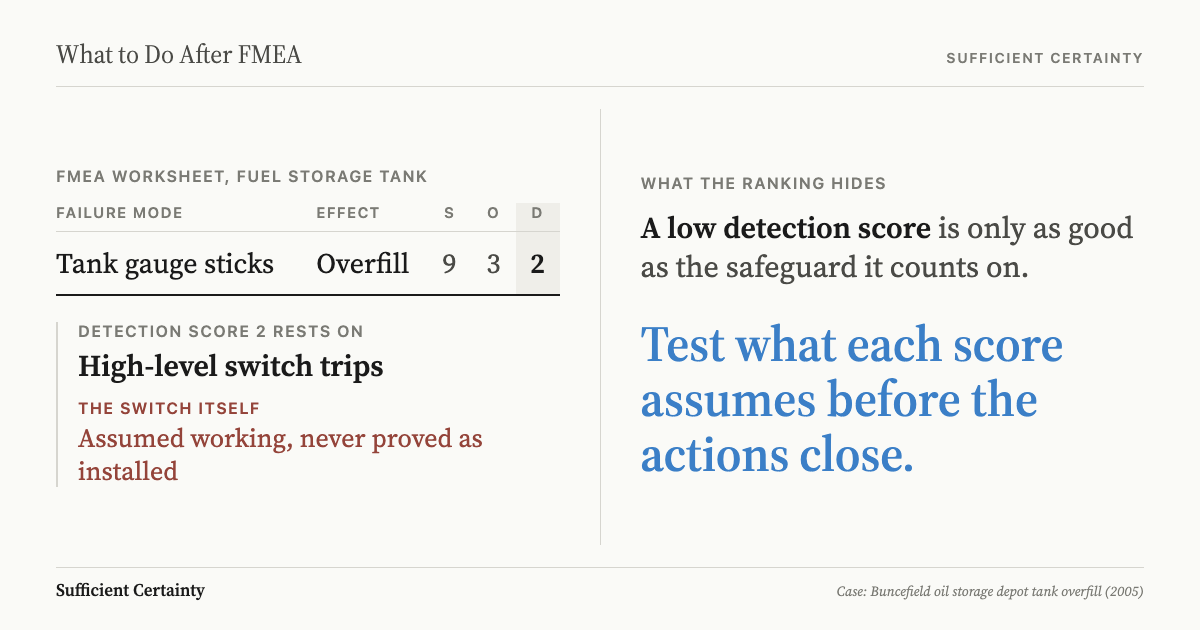
The method does not check its own inputs. A detection score of 2 records the team's view that a control will catch the failure. The worksheet has no column for whether anyone has seen that control work on the installed equipment, or for how often the failure has already happened. The evidence needed to approve work is also the central question after a biological risk assessment, where a critical control must be verified before material moves.
For failures combined in a system model, the follow-up to a fault tree analysis checks the smallest combinations against the actual system logic.
Pick the FMEA row whose detection score leans hardest on a second safeguard, and check that the safeguard works as installed before the action closes. Start the Walk →
Buncefield's stuck gauge and the switch without its padlock
On the evening of Saturday 10 December 2005, Tank 912 at the Hertfordshire Oil Storage Limited (HOSL) site within the Buncefield depot, Hemel Hempstead, began filling with unleaded petrol from 18:50. The tank held 6 million litres. It had two level protections: an automatic tank gauge (ATG) feeding alarms in the control room, and an independent high-level switch (IHLS), set higher, to sound a final alarm and shut off the supply.
At 03:05 on the Sunday the gauge flatlined: it stopped registering the rising level, so its three alarms could not go off. The switch did not register the rise either, so the final alarm and automatic shutdown never came. By 05:37 petrol was spilling from vents in the tank roof, and a vapour cloud spread to about 360 metres across. At 06:01 the fire alarm started the firewater pump and the cloud exploded. Over 250,000 litres of petrol had escaped.
Neither failure was new. The competent authority's report, Buncefield: Why did it happen? (2011), records that the gauge had stuck 14 times since the tank returned to service on 31 August 2005. Supervisors sometimes freed it by hand, and sometimes the contractor was called out. The sticking was not logged consistently, the operations manager did not know how often it happened, and the root cause was never properly identified.
The switch needed a padlock to hold its test lever in the working position. The supplier did not make that clear, and the installer appears to have thought the padlock only stopped tampering, so it was never fitted. It was tested periodically, and afterwards the lever was left where it could disable the switch.
HOSL is not known to have run a formal FMEA, so what follows is a reconstruction. The overfill row would read: failure mode, gauge sticks; effect, overfill; S 9, O 3, D 2. The low detection score comes from the switch behind the gauge. The switch has no row of its own. It appears only as the reason the gauge row looks safe.
The report describes how the two failures fed each other: the unreliable gauge meant more dependence on the switch, and the often inoperable switch meant more reliance on the gauge. Management "failed to scrutinise the combined unreliability" of the two. On the reconstructed row, D 2 assumes the switch will work on the night the gauge fails.
The severity score rested on an assumption as well. The report states that the explosion was "far greater than could reasonably have been anticipated based on knowledge at the time". Over 40 people were injured and the fire engulfed more than 20 fuel tanks. Five companies were convicted, and HSE puts their combined fines and costs at almost £10m.
How do you check the safeguard behind a low detection score?
Before the recommended actions are closed out, sort the worksheet by detection. Every row scored 1 to 3 is a claim that some control will catch the failure. Mark the rows where that control is a second safeguard: a trip, an interlock, an alarm, or an inspection by another team.
For each marked row, write the assumption behind the detection score as one sentence beside it. List the evidence that exists for it: test records for the device as installed, the defect log, contractor call-outs. Each sentence records one of the assumptions behind the decision to close the row.
Take the reconstructed Tank 912 row. The assumption behind D 2 reads: the independent high-level switch will trip at its set level and stop the supply if the gauge sticks. The first evidence is the gauge's own history: 14 stuck events since 31 August 2005, not all of them logged, so the real count means reading shift logs and call-outs too.
For the switch, the question is whether it has been shown to trip as installed, with its test lever locked in the working position. The engineer needs a witnessed trip test on the tank, a check that the padlock is fitted, and a check of where the lever was left after the last test.
Next, decide whether the evidence is enough. The evidence checkpoint after a HAZOP study asks whether each safety recommendation supports the intended operating state. A cosmetic defect can close on a judgement call. A row whose worst effect is a petrol vapour cloud drifting off site needs the switch proven first. The Universal Decision-Making Method treats that level of certainty as a choice made before acting, together with what will be monitored afterwards.
Then re-score the row. Occurrence rises, for example from 3 to 7, because the gauge stuck 14 times in just over three months. Detection rises, from 2 to 8, because the switch is unproven. The action changes from "maintain gauge" to "prove the switch trips at the set level on Tank 912, fit the padlock, and check the lever position after every test". A second action: find and fix the cause of the sticking.
Last, write the trigger that reopens the row for re-scoring: any repeat of the gauge sticking, and any maintenance, test or replacement of the switch. The HSE report concludes that a thorough defect log, properly scrutinised by senior management, would have revealed how vulnerable the overall system was.
The same check applies to any risk analysis that credits one control for covering another. File the written assumptions and triggers with the control plan.
HOSL had a detection control on paper for every overfill at Tank 912. What it didn't have was certainty that the high-level switch behind the gauge would trip.
Work through your decisionNo sign-up. Just pick your decision and start.
Grant Purdy is the co-author, with Roger Estall, of Deciding (2020), and the architect of the Universal Decision-Making Method.