
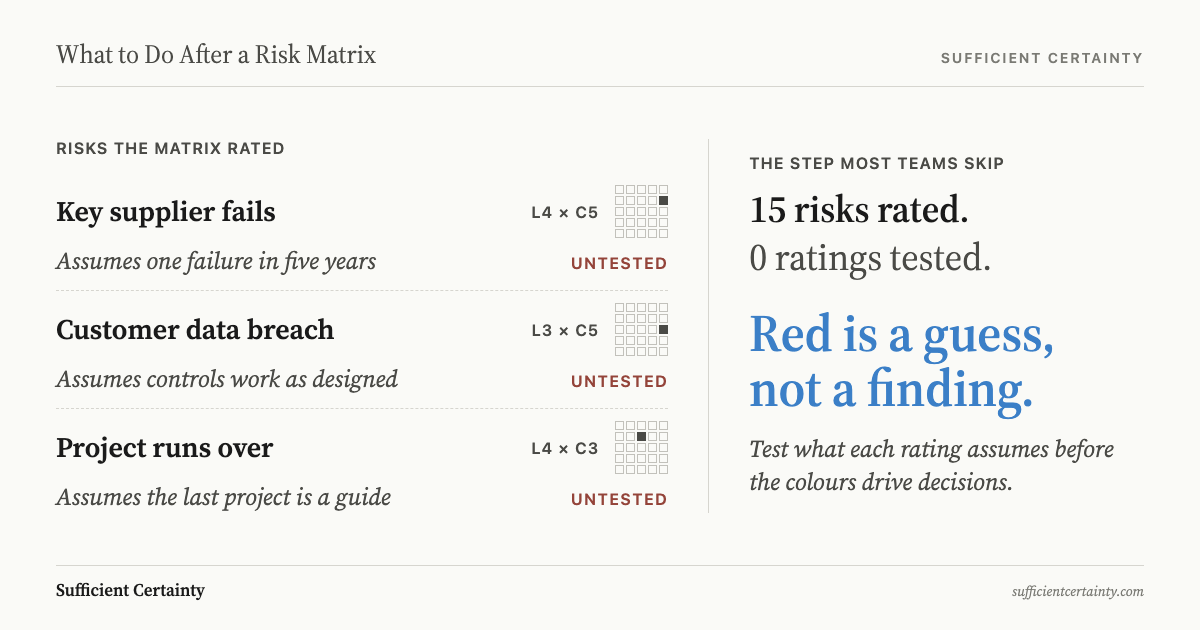
After a risk matrix, test the assumptions behind each likelihood and consequence rating before the colours decide what gets treated, escalated or left alone. Every cell on the grid looks like a finding, yet each one is a judgement with its reasoning stripped out. In 2005, one of those judgements moved a catastrophic fire hazard on an RAF aircraft into the tolerable band, and nobody checked it.
A risk matrix is a grid that rates each risk by likelihood and consequence, then assigns it a priority colour or class where the two ratings meet.
The standard next step after a risk matrix
The matrix is usually the product of risk analysis. Each identified risk is scored on a likelihood scale and a consequence scale, often five points each, and plotted. The cell it lands in carries a colour, and in most organisations the colour carries a rule. That rule is where the risk assessment turns into action.
Practitioners then follow a familiar sequence. First, rank the risks by colour: red at the top, amber below, green treated as routine. Second, assign each risk an owner. Third, write treatment plans for the reds and ambers, with controls meant to cut likelihood or consequence and a target rating once those controls are in place.
Fourth, escalate. Most frameworks tie colour to authority. Red risks go to the executive or the risk committee, amber stays with the business unit, green sits with line management. Fifth, populate the register: inherent and residual ratings, owners, controls, due dates. A risk register built this way becomes the organisation's official record of what matters.
Sixth, set a review cycle. Ratings are re-scored quarterly, the heat map goes into the board pack, and arrows show which risks moved. Each review asks whether a rating has changed since last time. The question rarely asked is whether the rating was ever right.
What that step adds
The matrix gives people from different disciplines a shared language. An engineer, a finance director and a non-executive can discuss the same hazard without arguing over units or models. That convenience explains much of its spread: Thomas, Bratvold and Bickel (2014) reviewed 30 industry papers promoting matrices as best practice and found their case rested on ease of use: a matrix is simple to construct, explain and score.
It forces prioritisation. Attention and budget are finite, and a ranked grid stops everything being treated as urgent. The colour thresholds usually reflect the organisation's stated risk appetite, so the ranking at least claims a link to what the board says it will accept.
It creates visibility. A heat map puts risk in front of directors in a form they can read in seconds, and a red cell is hard to ignore. Escalation rules mean the most serious items reach people with the authority to fund a response.
It also forces a conversation. A scoring workshop makes people say out loud what they fear and why, and disagreement about a rating often exposes the most useful information in the room. The matrix is a good way to start a conversation about risk. The trouble begins when it is treated as the end of one.
Pick the rating driving your largest treatment spend and write down what has to stay true for that colour to hold. Start the Walk →
Where the standard playbook breaks down
Behind every likelihood score sits a set of assumptions the grid never records. Calling a hazard "unlikely" presumes a view on how often the trigger occurs, how exposed people and assets are, whether the controls perform and how well the past predicts the future. None of that survives into the cell. The vocabulary is shaky too: Budescu, Broomell and Por (2009) found people assigned probabilities to terms like "likely" that departed significantly from official definitions, even with those definitions in front of them.
The grid then distorts what goes in. Of two risks, the smaller can land in the hotter cell, and risks far apart in expected loss can end up sharing a colour, as Cox (2008) demonstrated mathematically. The Thomas review found rankings that could flip on design choices as arbitrary as how the scales are numbered. Treatment, escalation and the register all take the colour on trust. Carried from one quarterly report to the next, a rating nobody tests hardens into fact.
The loss of RAF Nimrod XV230 shows how far that goes. Between 2001 and 2005, BAE Systems and the Ministry of Defence's Nimrod project team built a safety case for the fleet, sentencing 105 hazards on a matrix of likelihood and severity bands. A catastrophic hazard rated "Remote" was Class B, requiring management action. Rated "Improbable", it became Class C, tolerable.
Hazard H73 was a fire in the No. 7 Tank Dry Bay, where fuel pipes sat near a hot-air duct running at up to 420°C. BAE Systems left it unclassified. In March 2005, a project team safety manager moved it from "Remote" to "Improbable", with more than 30 other hazards, on one line: "A review of past incidences indicates no major occurrences of these hazards." Nearly four months earlier, a duct at the bottom of that bay failed in flight on another Nimrod, XV227.
Underneath the new rating sat assumptions nobody had checked. The safety case gave fuel leakage as "Improbable" from in-service data, while the RAF's Board of Inquiry later counted an average of 40 fuel leaks a year across the fleet between 2000 and 2005. The controls listed for the zone included fire detection and suppression. Neither existed there. Detection scores in an FMEA can rest on the same kind of unchecked control.
| Improbable | Remote or higher | |
|---|---|---|
| Catastrophic | H73, dry bay fire, as sentenced in March 2005 Class C, tolerable → moves right once the leak-rate assumption is tested | Class B at Remote, Class A above it: management action required |
| Marginal | Class D, broadly acceptable | Class C at Remote, rising to A as likelihood climbs |
On 2 September 2006, XV230 caught fire shortly after air-to-air refuelling over Afghanistan. All 14 people on board were killed. The Nimrod Review (2009) found the aim had been to document that risks were "Improbable" rather than to find out what they were, and concluded the loss would have been avoided had the safety case been done properly. The matrix did what it was built to do. It turned an untested rating into a colour, and the colour into a decision.
The step to take first
Before the colours drive treatment and escalation, open each rating back up. For every red, every amber, and any green that is carrying a lot of weight, write down what would have to be true for the likelihood and consequence scores to hold. A low likelihood usually assumes the controls work, exposure stays where it is, and the past is a fair guide to the future.
Then test the assumptions that matter against evidence, including the people closest to the work. At Nimrod, the fuel leak history later counted by the Board of Inquiry was the evidence the "Improbable" leak rating needed to face. Test the ratings that would change a decision if they moved, not every cell on the grid.
Start with the ratings where a small error does the most damage. A low likelihood set against a catastrophic consequence comes first, because a one-band shift changes its class. Next come ratings lowered at the last review without new data behind them, since a re-score justified by an absence of major incidents is the pattern that sentenced H73. After those, take any rating that leans on a control nobody has recently seen working.
For each one, pull the evidence most likely to contradict the score rather than confirm it: incident and near-miss logs, defect and maintenance records, audit findings on the controls the rating cites, and the account of the people who run the process. In a clinical risk assessment, the contradicting evidence is often already in the patient's own record; in a structural risk assessment, it can sit in the engineer's own wording. Where the evidence is thin, record that as a finding. A rating resting on sparse data can still be used, provided its owner knows how little stands behind it.
This is the Assumptions step of the five-step Universal Decision-Making Method: Frame, Tentative Elements, Assumptions, Sufficient Certainty, Implement and Monitor. Frame the decision the matrix is feeding, whether to treat, escalate or accept. Treat the ratings as tentative elements. Surface and test the assumptions behind each score, then decide whether the evidence gives sufficient certainty to act.
The ratings that survive go forward into risk evaluation and treatment with their reasoning attached. The assumptions they depend on become the things to monitor, so a change in leak rates or control performance triggers a re-rating rather than waiting for the next quarterly review. Teams that find the grid itself getting in the way can look at a risk matrix alternative built around the live decision.
A colour on a risk matrix is only as reliable as the assumption underneath it. Test the assumption first, and the colour earns the authority it is given.
You could fund a treatment plan for every red cell and still leave the ratings that put them there untested.
Work through your decisionNo sign-up. Just pick your decision and start.
Grant Purdy is the co-author, with Roger Estall, of Deciding (2020), and the architect of the Universal Decision-Making Method.