
A WSJF example is only as reliable as the Cost of Delay feeding the formula, and in most organisations that number has no financial basis. Eighty-five per cent of product managers cannot quantify what delay costs in actual money, so the scores carry a precision their inputs do not support.
I sat through a PI Planning session last year where the Product Owner had done everything the textbook recommends. She had a scored WSJF table: time criticality and business value rated on a Fibonacci scale, divided by estimated job size, eighteen features ranked in descending order. She had printed copies for the room and projected the ranking on the screen behind her.
The room was fifteen minutes from approving the backlog when the CFO asked a single question: what does a time-criticality score of eight actually cost us per week in revenue?
The Product Owner looked at her spreadsheet and could not answer, because the score had never been derived from revenue. That is the problem with nearly every WSJF example I encounter: the ranking looks precise, but the economic input that makes the formula meaningful was never calculated. Three features from that session show what happened when the team went back and priced delay in dollars.
WSJF (Weighted Shortest Job First) is a sequencing method that divides a backlog item's Cost of Delay by its delivery duration, ranking items so the highest return ships first.
What a Real WSJF Example Looks Like
The executive dashboard draws a Fibonacci Cost of Delay proxy of 13, because the executive sponsor is vocal and the feature has board-level visibility. The API migration draws a 5; infrastructure work rarely scores well in rooms where stakeholders advocate for their own projects. The compliance update, with a hard regulatory deadline, gets an 8.
Divide each by estimated job sizes of 5, 3, and 5 respectively and the proxy ranking puts the dashboard first at 2.6, the API migration second at 1.67, the compliance update last at 1.6. The pattern is consistent with the inversions I see in practice.
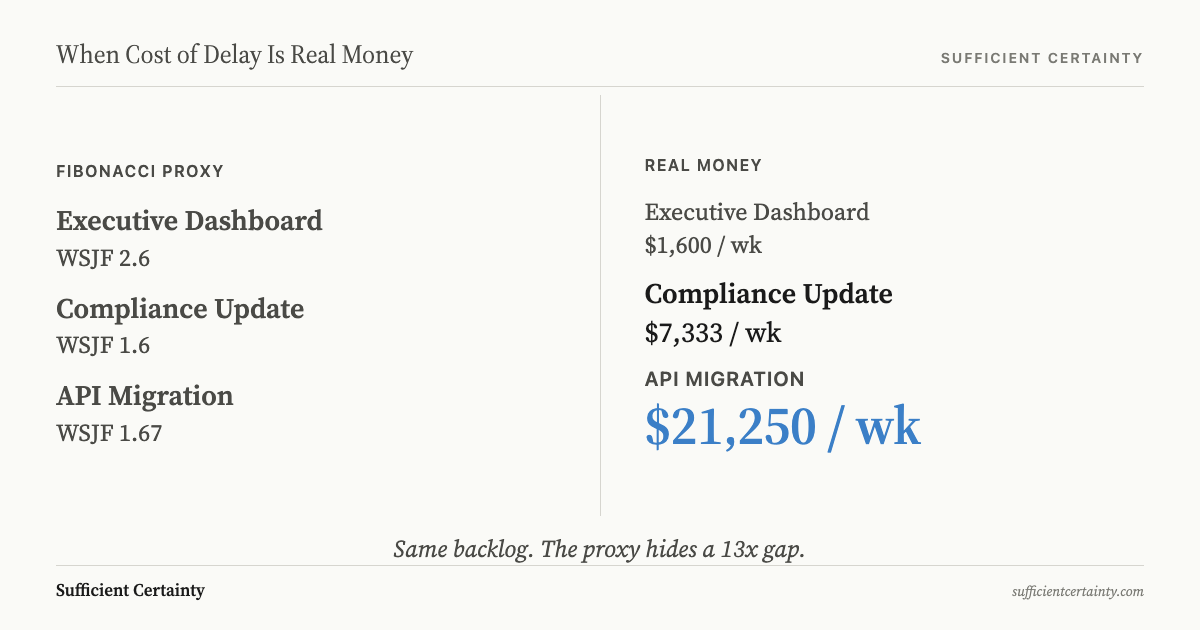
When the team prices those same delays in actual money, the rankings invert. The API migration, whose downstream failures generate $85,000 per week in manual workarounds and SLA penalties, produces a cost-of-delay figure that dwarfs the dashboard at $8,000 per week. The compliance update, accruing $22,000 per week in penalty exposure over a three-week build, lands between them. The only thing that changed was replacing Fibonacci intuition with a conversation between the product team and the finance department.
Once the rankings are recalculated in money, the sprint plan writes itself. The API migration's weekly delay cost of $85,000, divided by four weeks of development effort, produces a WSJF of $21,250 per week: the highest economic return per unit of time on the board. The compliance update, at $22,000 divided by three weeks, returns $7,333 per week and ranks second. The executive dashboard, at $8,000 in weekly delay cost across five weeks of effort, returns $1,600 per week and drops to the bottom. The gap between first and last is a factor of thirteen, entirely invisible in the original Fibonacci table.
The team that does this work gains something the Fibonacci table never provided: a defensible basis for saying no to lower-ranked items. When a VP asks why the API migration ships before the executive dashboard, "our WSJF score was higher" is not an answer anyone who controls a budget will accept. But "the migration costs us $85,000 per week in delay while the dashboard costs $8,000" gives finance a figure they can verify and act on. That is a conversation that survives scrutiny.
Take the backlog item your team ranked highest and test whether the cost-of-delay estimate it rests on would survive a second opinion. Start the Walk →
Why the Proxy Hid a 13x Gap
Don Reinertsen, who formalised the Cost of Delay framework that WSJF depends on, reported in The Principles of Product Development Flow that eighty-five per cent of product managers cannot quantify the Cost of Delay for their own projects. Among those who try, individual estimates typically differ by a factor of fifty to one.
The Cost of Delay discipline that Scrum.org describes confirms his finding: most product teams skip the pricing step entirely. They know the WSJF formula and can recite the three proxy components, but in my experience they have never sat down with finance to determine what a one-week delay on a given feature costs the business in contract penalties or lost revenue.
Michael Küsters published a mathematical critique of WSJF scoring in 2021 that shows the arithmetic consequences. A single-notch estimation error on a Fibonacci scale produces a 2.5x variance in the resulting WSJF score. Two notches produce 6x. In his worked case, Item D should rank first with an actual WSJF of 6.5 but appears last with an estimated WSJF of 0.4: a 16x distortion generated entirely by the scale.
His summary is direct: "We turn haphazard guesswork into a science, and think we're making sound business decisions because we 'have done the numbers.'" The disagreement between team members about what the scores mean is not a calibration problem. It is evidence that the inputs have no common basis.
Reinertsen wrote his prescription in 2009: "If you only quantify one thing, quantify the cost of delay." The SAFe framework that adopted his formula still instructs teams to use relative Fibonacci scores rather than requiring a dollar figure. The framework preserved the mathematics while discarding the economic discipline that makes the mathematics worth running.
A WSJF Example From a $100M IT Portfolio
The best-documented case of WSJF economics applied at portfolio scale is Maersk Line. Joshua Arnold and Ozlem Yuce reported in their 2013 Agile Conference paper (later summarised on the Black Swan Farming blog) that the shipping conglomerate applied CD3 (Cost of Delay Divided by Duration, Reinertsen's original term) across a $100 million annual IT portfolio.
One feature had accumulated thirty-eight weeks of waiting before the team reframed prioritisation around economic cost. Instead of asking "how much does this cost to build?" they asked "how much does it cost us every week we do not have it?" That question changed the sequence, because the answers were in dollars, not in Fibonacci proxies that nobody could defend.
Arnold and Yuce called the approach "black swan farming": deliberately searching for small, overlooked backlog items whose economic value per unit of development time exceeds the items that dominate the roadmap because of their visibility or political backing. The feature that had waited thirty-eight weeks was exactly this kind of overlooked asset; it was not complex to build, but it had been invisible in a prioritisation system that rewarded initiative size over economic return.
Analysis by IHS, reported by Supply & Demand Chain Executive, found that a single twelve-month product delay costs an industrial OEM up to $200 million and a Tier 1 supplier approximately $15 million. Those figures are cash the business did not collect because something else shipped first.
Your WSJF Scores Expire Faster Than the Sprint
Even a well-constructed WSJF table degrades the moment market conditions change. A competitor announcing a similar feature or a regulation moving its enforcement date forward can alter the economic basis of half the backlog overnight, yet the scored table stays pinned to the assumptions the room held at the last Program Increment planning session.
In one program I reviewed last year, the Cost of Delay for a payments integration tripled in a single week after a competitor launched an equivalent capability and the sales team reported losing two enterprise deals to the gap.
The WSJF table from PI Planning still had the payments feature ranked fourth out of twelve. By the time the RTE recalculated, the team had already committed to building the first-ranked feature, which now carried a lower economic return under the changed conditions.
Roger Estall and I wrote in Deciding that the same option carries a different weight depending on when you evaluate it, because the assumptions supporting it shift as conditions change. Waiting makes every option worse, and a trade-off analysis that treats Cost of Delay as a fixed number is paperwork, not decision-making.
The question worth asking is not "what did we score this at PI Planning?" but "what would we score it now, given what has happened since?" The Universal Decision-Making Method requires exactly this: identify the assumptions a decision rests on, and revisit them when competing priorities force a re-evaluation. Any prioritisation matrix that skips re-evaluation will produce stale rankings. A WSJF example is a snapshot, and treating it as a permanent verdict means shipping the wrong thing first.
You could rank every feature by proxy score and still ship the wrong one first.
Work through your decisionNo sign-up. Just pick your decision and start.
Grant Purdy is the co-author, with Roger Estall, of Deciding (2020), and the architect of the Universal Decision-Making Method.