
An operations director sent me her gap analysis two days before the capital committee met: a current-state figure of 41% of shipments out of the regional hub arriving with a packaging defect, a desired-state target under 5%, four root causes ranked by frequency across eleven pages, and a nine-month closure plan costed at $340,000.
Every column was filled in except the one that mattered, whether the 36 points still open were worth $340,000 and nine months of the plant's attention, or whether the business would come out ahead leaving the gap alone while a bigger changeover already under way settled down.
That is the question a gap analysis example is not built to answer. She did not need the steps explained. She had already run them.
A gap analysis is a comparison between the current state of something and the state you want it to reach, used to identify what separates the two and what it would take to close that distance.
What a gap analysis actually covers
Every version of the exercise, from a capability review to a skills gap analysis, runs the same shape. State where you are and where you want to be, both in numbers that can be checked, then name what separates the two and what closing it would cost. Roger Kaufman's original needs-assessment work from the 1970s is where this discipline comes from in its modern form, and Kaufman drew one line most templates have since dropped: a need is a gap in results, not a gap in resources. Wanting more staff or more budget is a want dressed up as a need. The gap worth measuring shows up in a defect rate or a renewal figure, whatever the decision in front of you is actually about.
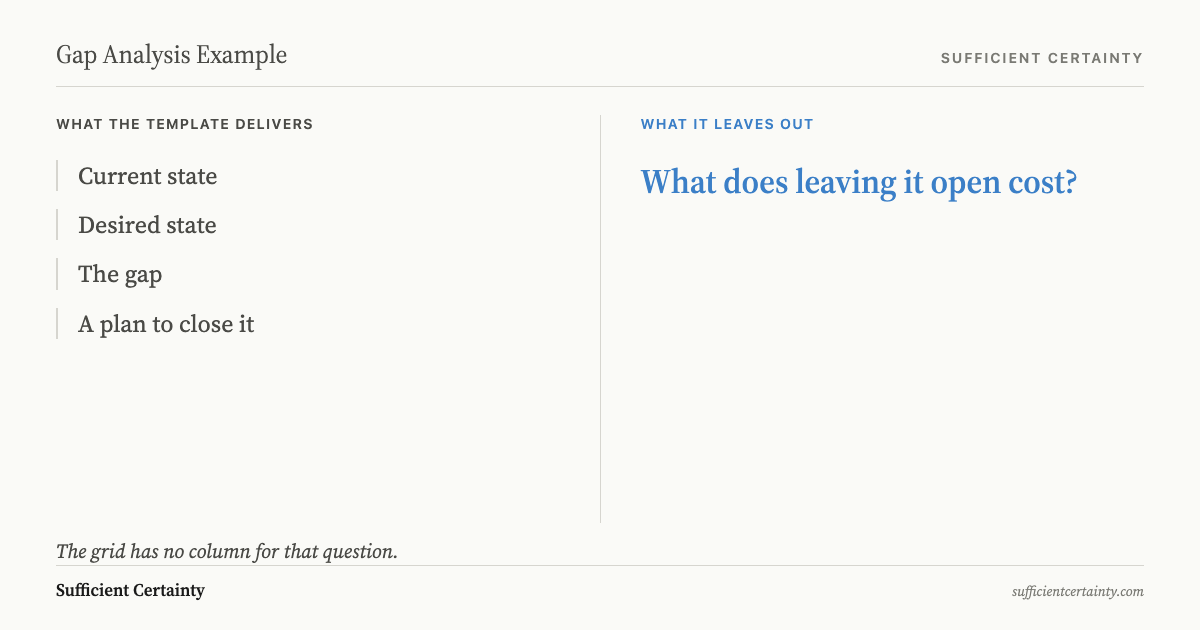
Run those moves properly and you get an honest picture of the distance. You do not get a decision. Nothing in the exercise asks whether the distance is worth closing, and the standard grid has no column for that question. It has a column for the fix and a column for the cost of the fix, but nothing for what the fix is being weighed against, which is doing nothing. That is why the exercise belongs inside a broader situation analysis, not standing alone as the last step before a funding ask.
Filling every column still is not the hard part
I have sat through more of these presentations than I can count, and the room relaxes at the same moment every time: when the gap column is full. A number for where you are, a number for where you want to be, a completed grid, and the tension drops as if the decision has already been made, when it hasn't. A grid describing a gap is not different in kind from a register listing forty unweighted assumptions. Both feel like the analytical work is done. Neither has tested whether what it describes is significant enough to act on.
That is not an accident of the format. Every one of the template vendors selling this exercise online has a product that is the grid, not your decision, so naturally the deliverable stops where the grid ends. Nobody sells you the column that would shorten the sales page. The two numbers the committee actually needs, what the gap costs to leave open and what it costs to close, are two different figures, and only one of them shows up on most templates.
Price what the gap costs to leave open for the nine months closing it would take, then compare that figure to the fix before the meeting does it for you. Start the Walk →
The most rigorous gap analysis in existence treats leaving it open as a real answer
The clearest example I know of an organisation treating "leave it open" as a real answer is the U.S. Department of Defense. Its Joint Capabilities Integration and Development System is the most heavily audited capability-gap process there is. Before anyone can buy new equipment to close a confirmed gap, the process requires every non-materiel option, whether a training fix or a policy change, to be ruled out first. Only once those fail does new hardware get approved.
Then it hands whoever confirmed the gap a genuine choice most commercial exercises never offer. Accept the operational risk and do nothing further, or fix it without buying anything, or commit the money to new equipment. Accepting the risk is a codified, deliberate outcome inside that framework, and defence planners choose it regularly.
A search for a gap analysis example turns up the same four-box grid every time, ending in a gap column and an action column with nothing beyond them. None of them has a box for confirmed gap, decided not to close it. The template assumes closing is what happens next, which tells you more about who sells the template than about what the exercise is for.
What it costs when nobody tests whether the gap is worth closing
Even that process is not immune to momentum. The Army has run three separate acquisition efforts over eight years to close an augmented-reality capability gap for its infantry. The Government Accountability Office reported that close to 10,000 units have been produced and are going into storage rather than being issued, because the goggles still do not meet what soldiers need. I find it remarkable that the formal option to accept the gap and stop existed the whole time, and nobody exercised it. The commitment kept renewing itself because each review inherited the sunk cost of the previous one.
I have seen versions of this in commercial settings too, without the formal option to stop ever appearing on paper. Lidl went live with SAP for Retail in 2015, aiming eventually to cover more than 10,000 stores. Computer Weekly reported that the German discount grocer abandoned the project roughly three years later, about half a billion euros in, and reverted to its old system. The gap between what Lidl's inventory processes needed and what the new platform delivered was identifiable before go-live. That is exactly what a fit-gap exercise is supposed to price before commitment, not discover across three years of consulting spend after the pilot is already running.
Run the test on your own gap analysis before you present it
Go back to the shipping numbers: a 41% defect rate, a target under 5%, and a fix costed at $340,000 and nine months. Any competent gap analysis template gives you that much. The two figures it does not give you are the ones the committee actually needed: what the business loses for every month the defect rate stays at 41%, and whether that figure, multiplied by nine months, is more or less than $340,000. If it is more, fund the fix. If it is less, and the changeover already under way is likely to move the number anyway, the honest recommendation is to wait and remeasure, not to spend the money because the deck is ready.
That is the same test the Universal Decision-Making Method applies to any decision, not only this one: what does it rest on, how much does that matter to the outcome, and is there enough certainty in it to commit resources. The exercise is a snapshot of two states, not a decision framework, because the current-state column is itself an assumption about where things stand today, one the grid will never flag as questionable. When the gap analysis is strategic rather than operational, the assumptions multiply: testing those assumptions before the roadmap gets funded is the step most planning teams skip.
Before a completed gap analysis goes into a funding meeting, add the column every template leaves out: the cost of leaving it open for the period closing it would take, set against the cost of the fix.
Most of the surrounding work is already done. Due diligence confirmed the current state is real, and the situation analysis template already has the desired state written down.
What is missing is one number and one comparison, and the committee that asked for it was always going to ask for it anyway, usually five minutes after the grid goes up on screen.
You could fill every column and still miss the one the committee needs.
Work through your decisionNo sign-up. Just pick your decision and start.
Grant Purdy is the co-author, with Roger Estall, of Deciding (2020), and the architect of the Universal Decision-Making Method.