
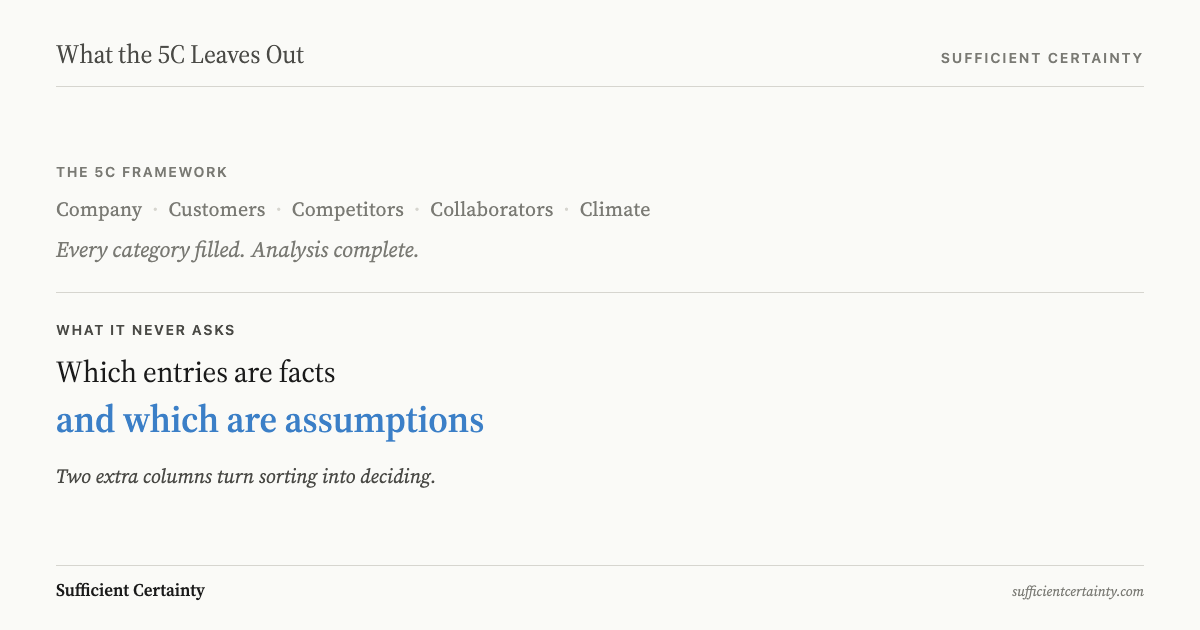
A marketing situation analysis built on the 5C framework sorts observations but never tests them. Two columns are missing from every standard template: which assumption each observation carries, and how significant that assumption is to the campaign decision. Without those columns, the analysis is a filing exercise.
Situation analysis in marketing usually produces a thorough inventory of market conditions that changes nothing about the decision. The analysis describes the landscape without testing the assumption the campaign depends on. A useful marketing situation analysis starts with the decision, names what must be true for the strategy to work, and tests that claim against evidence.
A marketing director at a consumer goods company showed me her team's marketing situation analysis last year. They had spent three weeks completing every section of the 5C framework, and the final deck ran to forty-two slides. The company section alone was seven pages. Customer data went back four years, with purchase frequency broken out by segment. The competitive matrix compared nine direct competitors on pricing and distribution reach.
I read all of it. I could not find a single sentence stating what the team assumed to be true about any of the data they had collected.
I have reviewed hundreds of these analyses, and the satisfaction always comes from filling every box, not from knowing what you are betting on. The 5C framework tells you where to put your observations, but it does not tell you which of them are established facts and which are beliefs that have not been tested. The distinction matters because the decision your team makes after the analysis depends entirely on whether those beliefs turn out to be true.
A marketing situation analysis is the practice of mapping a company's competitive position, customer base, and market conditions before a marketing decision, sorting observations into categories without testing them.
What a marketing situation analysis actually produces
The 5C asks you to map five categories: Company, Customers, Competitors, Collaborators, and Climate. Each category gets a column or a slide, and you fill it with whatever data you can gather: market share figures and customer demographics. When every column has content, the analysis is considered complete.
The result is a sorting exercise, not a tested foundation for a decision. None of the entries have been examined for the assumptions they contain. The "Customers" column might say your target segment values quality over price, but the grid does not record whether that claim comes from transaction data, a focus group of twelve people, or the marketing director's instinct. All three sources produce the same entry, and the grid cannot distinguish between them.
Marketing teams are particularly susceptible to this problem because they typically have more data available than most other functions: customer surveys, A/B test results, market share reports. The volume creates a feeling of thoroughness. Data describes what happened in the past under a specific set of conditions. The moment those conditions shift, every data-backed entry in the 5C becomes an assumption about whether the past pattern will hold, and the framework has no mechanism for flagging that transition.
I keep asking who benefits from a framework that produces completeness without accountability, and the answer is always the same: the consultants selling 5C workshops and the teams using a filled grid to justify decisions they have already made.
Tropicana and Coca-Cola tested everything except the assumption that mattered
In 2009, PepsiCo invested $35 million to redesign Tropicana Pure Premium's packaging for the North American market. The Arnell Group replaced the iconic straw-in-orange image with a glass of orange juice, aligning with a consumer trend toward clean, modern aesthetics. The 5C analysis behind the decision was thorough by any textbook standard: Tropicana was the market leader in premium not-from-concentrate juice, consumer research had been conducted, and the brand was positioned clearly against store-brand alternatives.
Within seven weeks, unit sales had dropped 20 percent and dollar sales had fallen roughly $33 million. PepsiCo reversed the redesign on 23 February 2009, less than two months after launch, on a brand generating $700 million a year in revenue. An untested assumption about a single column in the 5C grid had produced one of the most expensive packaging failures in consumer goods history.
The assumption hiding in the "Customers" data was this: shoppers will transfer brand loyalty to a modernised visual identity. Nobody tested it. The straw-in-orange was how people found their juice on the shelf. The research measured aesthetic preference but did not measure whether removing a recognition cue would change purchase behaviour at the point of sale. I have watched teams spend months on customer research that answered the question they wanted to ask instead of the question the decision required.
Coca-Cola made the same mistake twenty-four years earlier. Between 1981 and 1985, the company conducted nearly 200,000 taste tests, and respondents consistently preferred a sweeter formula. On 23 April 1985, Coca-Cola replaced the original recipe with New Coke. The backlash was immediate and overwhelming. Seventy-nine days later, the company reversed the decision.
But only 20 percent of those tests used the final formula, and none of them measured whether consumers would accept a formula change at all. The tests measured sip preference in isolation, stripped of brand meaning and identity. The assumption embedded in that customer data was that blind taste preference predicts purchase behaviour when the brand name is attached, and 200,000 data points measuring the wrong thing did not make it true.
Both cases illustrate the same gap in a marketing situation analysis. The 5C framework gave both teams a place to record customer research, but neither the framework nor the teams distinguished between a research finding and the assumption that finding was taken to support. The five steps that turn a situation analysis into a decision start precisely where both teams stopped.
Take the 5C grid your team is building and write the assumption behind each entry before the recommendation goes forward. Start the Walk →
Nike dropped wholesale partners on an untested assumption
Beginning in 2017 and accelerating through the pandemic, Nike cut wholesale partners to shift sales to Nike Direct. The strategy rested on a thorough marketing situation analysis of the company's position: the strongest brand in athletic footwear, customers visibly shifting to online shopping, and wholesale partners that appeared to be diluting margins without contributing anything Nike could not provide on its own. The "Collaborators" column in the 5C framed wholesale as a cost, not a source of demand. I want to know who wrote that column, because it reads as a justification for a decision already made rather than an observation open to challenge.
By fiscal 2024, annual revenue fell for the first time in over a decade. First-quarter fiscal 2025 showed revenues down 10 percent year on year, Nike Direct revenue down 13 percent, and digital sales down 20 percent. The stock fell approximately 30 percent from its 2023 peak. By late 2024, Nike was re-entering wholesale with DSW and Macy's, reversing a strategy it had spent seven years building.
What the 5C did not capture was the role wholesale partners played beyond distribution. Foot Locker and Dick's Sporting Goods delivered impulse buyers and casual shoppers that Nike.com never reached. When Nike vacated the shelf space, smaller competitors filled it. The erosion was gradual: DTC growth metrics looked strong enough to mask the wholesale demand loss for several years. The column looked exactly as reliable in 2023 as it had in 2017, and nothing in the grid distinguished a current fact from a decaying one. The same failure appears across situation analysis examples from industries with no connection to marketing.
Ron Johnson at JCPenney made the same error in 2012, when he eliminated coupons and promotional pricing in favour of fixed pricing tiers. He refused to pilot-test the strategy on a single store. Revenue dropped by roughly a quarter, comparable sales fell 25.2 percent, and his tenure lasted seventeen months. His own admission afterwards: "We did not realise how deep some of the customers were into coupons." He had the confidence that comes from a completed template, but no evidence that his customers would accept the change.
Two columns that complete a marketing situation analysis
The 5C gives you five categories. When Roger Estall and I wrote Deciding, we included a context template with columns that every standard framework leaves out. For every observation in every category, the Universal Decision-Making Method asks two questions: what are you assuming, and how significant is that assumption to the decision?
The first column is Assumption: the belief the data point is being used to support, recorded separately from the observation itself. Tropicana's customer research said consumers liked modern design; the assumption was that shoppers would transfer brand loyalty to a modernised visual identity. Coca-Cola's taste tests said people preferred a sweeter formula; the assumption was that blind sip preference predicts purchase behaviour. Nike's margin analysis said wholesale was expensive; the assumption was that wholesale partners contributed distribution but not demand. Recording the assumption forces you to see the gap between what you measured and what you are acting on.
The second column is Significance: how much does this assumption influence the decision, and how confident are you that it is true? The Universal Decision-Making Method uses a significance matrix that sorts assumptions into four quadrants by plotting confidence against influence. The assumptions that matter most sit in what we call the Critical quadrant: high influence on the outcome, low confidence in the assumption's truth. Tropicana's recognition assumption was high-influence because it determined whether people could find the product on the shelf, and low-confidence because it had never been tested in a retail setting. Had the team plotted it, they would have known it needed testing before committing $35 million.
The categories remain useful for organising your observations about the company and its competitive position. What changes is the output: instead of a filled grid that the team treats as finished, you produce a register of what you are betting on and where the evidence is thin. A situation analysis that reaches a decision rather than a document starts with these two columns and adds three more that most frameworks never attempt.
You could finish the next marketing situation analysis and still commit to an assumption nobody tested.
Work through your decisionNo sign-up. Just pick your decision and start.
Grant Purdy is the co-author, with Roger Estall, of Deciding (2020), and the architect of the Universal Decision-Making Method.