
After a usability test, most teams rank the problems they observed, fix the worst ones and treat a clean retest as permission to launch. The step they skip is testing the assumptions that decided what the test could see.
A usability test observes representative users attempting realistic tasks with a product, to find where they struggle and measure effectiveness, efficiency and satisfaction.
The standard next step after a usability test
The textbook sequence is short. Researchers review the recordings and notes, group observations into distinct problems, and give each one a severity rating based on how many participants hit it and how badly it blocked them. The output is a findings report: task completion rates, time on task, a satisfaction score and a ranked list of problems with recommended fixes.
Most teams run small rounds. The rule of thumb that five participants find most problems traces back to a model published by Nielsen and Landauer (1993), which treated problem discovery as a curve of diminishing returns: each extra participant mostly repeats problems already seen. A design sprint leans on the same rule for its Friday test, which is why the verdict after a design sprint needs its conditions on record.
From there the report enters the backlog. Designers take the high-severity items, engineers estimate them, and a product owner decides which fixes ship before launch. The team retests the revised design, usually with a fresh group, and watches for the old problems to disappear. In many product teams this loop is the working core of a data-driven decision-making framework: observe, measure, fix, confirm.
When the retest comes back clean, the decision is effectively made. Completion rates are up, the severity list is short and satisfaction has improved. The findings report stops being a record of a few sessions and becomes the evidence that the product is ready.
What that step adds
The loop does real work. It replaces opinion about what users will do with observation of what they did. A designer who watches three of five participants miss the same button has evidence no design review can supply, and the fix is usually cheap because it arrives before launch.
It also gives teams a shared definition of success. ISO 9241-11 defines usability as the extent to which specified users can achieve specified goals with effectiveness, efficiency and satisfaction in a specified context of use. Those measures turn arguments about taste into figures a team can track across rounds, which is the kind of evidence-based decision making that holds up when a sponsor asks why a feature changed. Recorded sessions sit alongside the numbers, so the quantitative and qualitative evidence can check each other.
The method has also sharpened its own limits. Faulkner (2003) tested 60 participants and drew random groups from them. Some groups of five found 99 percent of the known problems; others found 55 percent. Every group of 20 found at least 95 percent. That result gives teams a reason to size a test to the stakes of the decision rather than to a rule of thumb.
Few methods in data-driven decision making give such direct evidence for so little money. The observation is sound. The trouble is how far the findings are asked to travel.
Rewrite the finding your launch decision rests on as a claim about real users in real conditions, and test it before a clean retest becomes permission to ship. Start the Walk →
Where the standard playbook breaks down
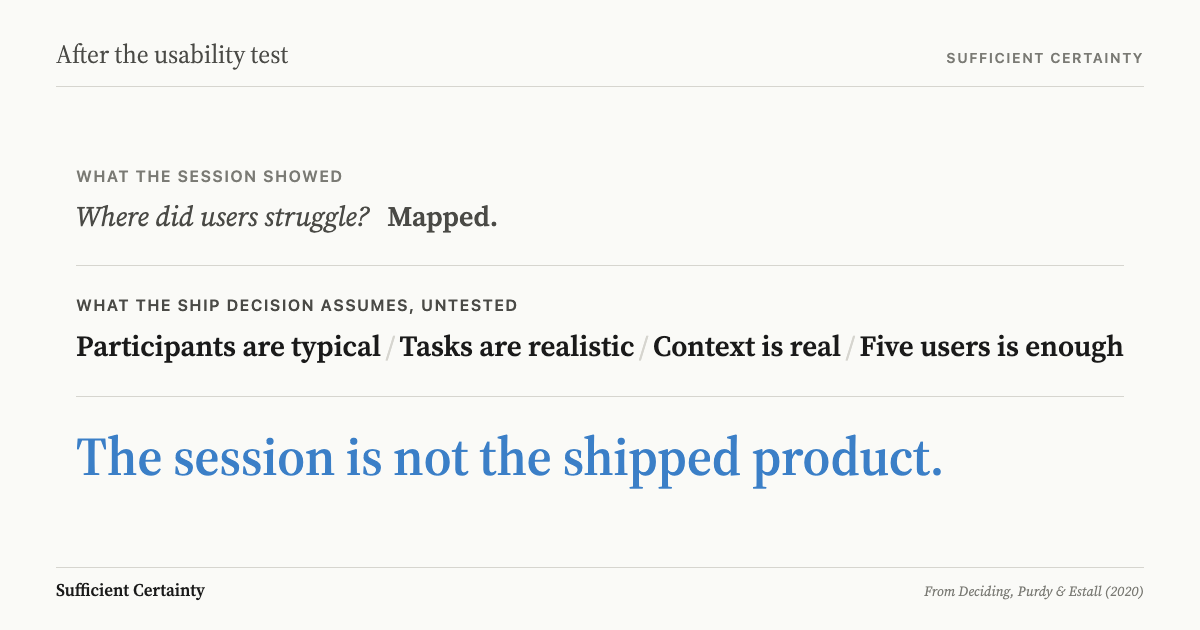
Every usability test fixes three things before the first participant arrives: who takes part, which tasks they attempt and the conditions they work in. The ISO definition says as much, because usability only exists relative to specified users, goals and context. A findings report describes the product under those conditions and says nothing about the conditions the test left out.
Sample size is the assumption teams argue about, because it is visible. The quieter assumptions are that participants resemble the people who will use the product, that test tasks resemble real ones, and that the success measure is the outcome the organisation actually needs. Exit interview analysis carries the same quiet assumption about who was asked.
Los Angeles County shows what happens when those quieter assumptions go unexamined. Its Voting Solutions for All People programme spent more than a decade building a publicly owned voting system through human-centred design with IDEO, including prototype sessions with community groups. In September 2019 the county ran a countywide mock election with 50 vote centres and 1,000 ballot marking devices. The final VSAP report recorded the results.
During the March 2020 primary, some voters faced long waits to check in. An independent review by Slalom found that the electronic pollbooks froze frequently, which the review traced to design and testing issues, including devices that needed significant processing power to sync during peak check-in. It also found that the "ePollbook system was not tested accordingly to meet the needs of a County the size of Los Angeles." The ratio of pollbooks to ballot marking devices had been estimated inaccurately. The plan also relied on 33 percent of voters voting early, which the review called a critical variable. Only 28 percent did.
The sample was not the problem. Six thousand participants sits far beyond any sample-size debate. What the mock election could not reproduce was a peak election day in the largest local voting jurisdiction in the country. Satisfaction with the check-in screen measured how check-in felt, not how many voters per hour it could process under load. Working out which numbers matter before the call means asking what each figure was measured under. The mock election answered whether people were satisfied using the system, and the rollout treated that answer as proof the system could carry an election.
The step to take first
Before the findings report becomes a launch decision, write down what the test assumed about users, tasks, context and success, and sort each assumption into verified or believed.
No second study is required. The Universal Decision-Making Method gives the exercise a structure: frame the decision the test is meant to inform, set out its tentative elements, surface the assumptions behind the findings, decide what level of certainty is sufficient, then implement and monitor. Framing does most of the early work. "Can people complete checkout?" and "Will checkout hold up on launch day for first-time customers on mobile?" are different decisions, and a standard test answers only the first.
Some of the untested items can be checked cheaply before launch: recruit a few participants from the segment missing from the sample, run one session on real devices in the real setting, or rehearse peak volume. Others cannot be settled in advance and need a monitor with a trigger, such as a queue length, an abandonment rate or a support-call volume that reopens the decision once crossed. An assumption that cannot be tested before launch should be watched from the first hour after it.
In Los Angeles, neither pollbook throughput at peak volume nor the early-voting share required a redesign of the ballot marking device. Each could have been written down as a believed assumption, with a load test attached to the first and a turnout trigger attached to the second during the eleven days of voting.
A usability test shows what users did under the conditions it chose. Deciding to launch means naming the conditions it did not.
You could close this tab and carry that decision into another week.
Work through your decisionNo sign-up. Just pick your decision and start.
Grant Purdy is the co-author, with Roger Estall, of Deciding (2020), and the architect of the Universal Decision-Making Method.