
After a benchmarking study, and before any gap goes into the budget or the improvement plan, get the list of companies you were compared against and find out who chose them and why. The results usually come back as a slide deck. A few pages in there is a bar chart of your figures against the peer median and quartiles, and someone has circled the bar that sits below the median.
That bar is about to become a target. The size of the gap depends on which companies were on the list.
A benchmarking study compares an organisation's performance, costs or pay against a chosen peer group or best-practice set, usually ending in a percentile position and targets.
Turning benchmarking results into targets
Once the study is accepted, most teams follow the same sequence. First the data is normalised: definitions aligned, currencies converted, and raw figures turned into ratios such as cost per transaction, so organisations of different sizes can be compared. Then comes the gap analysis, one metric at a time, against the peer median and quartiles.
Next the team picks a target position: the median for some metrics, the top quartile for the ones leadership cares most about. Each gap becomes a target with a number and a date, and an action plan with an owner. The targets flow into the budget, the improvement plan and whatever data-driven decision-making framework the organisation already uses.
Executive pay follows the same path with more at stake. A remuneration committee receives a consultant's peer analysis, sees the chief executive at the 40th percentile, and decides whether to move toward the median or the 75th percentile. The same study sets salary bands and bonus targets. Salary bands also need pay equity checks as the workforce changes. The minutes then cite the benchmark as the reason for the decision.
In the next cycle the study is repeated, often by the same provider with the same peer list. After a few rounds, nobody asks who chose the list.
Teams rarely stop to check the peer list before a gap becomes a target. The question of which numbers matter before the call gets answered by whichever measures the study included, against whichever companies were on the list.
Benchmarking gives you an outside reference point
None of this makes benchmarking a waste of money. Without it, an organisation judges its costs and pay against its own history, which only shows whether it is doing better than last year. A study shows what similar organisations achieve. It challenges comfortable internal assumptions, such as the belief that an overhead ratio is normal, and forces consistent definitions.
It does not need to be elaborate to be useful. The textbook story is Xerox studying its Japanese competitors' costs and learning warehouse methods from L.L. Bean, but most studies are a cost or pay survey bought from a consultant or an industry body. Even that tests an internal claim against outside evidence, the core of evidence-based decision-making.
In executive pay the practice is widespread. Bizjak, Lemmon and Naveen (2008) found that benchmarking had a significant effect on chief executive pay, and their results generally supported it as a way to gauge the market wage needed to retain an executive. The weak point is the peer group. Someone picks it, often without written criteria.
Pull the comparator list behind your benchmarking chart and write down which defensible peer group would make the gap you are about to close disappear. Start the Walk →
Who chose the peer group, and on what basis?
The peer group is chosen before any data is collected. Sometimes the consultant supplies a standard list for the sector. Sometimes HR or finance proposes one, or the chief executive's office adds names. Often it is last year's list. The criteria, if written down at all, tend to be size, industry and which companies the provider already has data for.
A different peer list gives a different gap. Against organisations of similar size, a company may sit near the median. Against the largest firms in its sector, the same figures can put it in the bottom or top quartile. This is the framing effect: the result depends on how the comparison is set up.
The choice is rarely neutral. Faulkender and Yang (2010) found that, after controlling for industry, size, visibility, responsibility and talent flows, firms appear to select highly paid peers to justify their chief executive's pay. That raises the benchmark before any analysis begins.
Would a different, reasonable peer group show the same gap?
The people who approve the targets rarely see the peer list. It sits in an appendix, agreed once and carried forward each year. Problem framing starts by putting that list in front of them, with the reasons it was chosen.
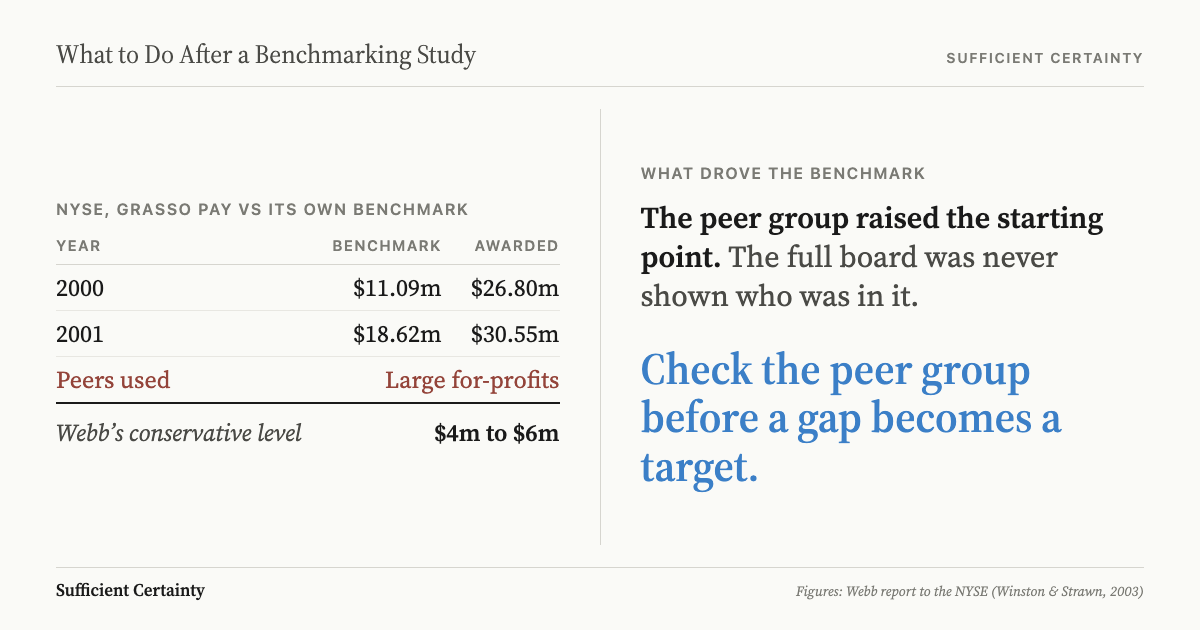
How the NYSE set Richard Grasso's pay benchmark
In 1996 the New York Stock Exchange's compensation committee adopted a policy of assessing executive pay against senior executives of large, for-profit companies, which it called the Comparator Group. Hewitt Associates was its consultant, and Mercer also compiled comparator data. Richard Grasso, chairman and chief executive, was benchmarked against that group. Merrill Lynch's chief executive, who ran a member firm the Exchange regulated, sat on the committee.
In December 2003 a review for the NYSE by Dan K. Webb of Winston & Strawn, the Webb report, found the committee "used an inappropriate comparator group for benchmarking Grasso's compensation levels, comparing Grasso to CEOs of large, profit-making institutions that are vastly different from the NYSE". Those companies were much larger than the Exchange in revenue, net income, employees and assets.
The committee also paid above its own benchmarks, in some years more than twice them. For 2000 the benchmark was $11.09 million and the award $26.8 million. For 2001 the benchmark was $18.62 million and the award $30.55 million. Webb's conservative estimate of what Grasso's yearly pay should have been was $4 million to $6 million, based on the median of an appropriate peer group. That is well below the committee's own benchmark.
Directors told Webb that when the committee presented Grasso's pay to the board, there was "no mention of the comparator group employed by the NYSE or any specific information about the benchmarking". Hewitt "did not advise the Committee that the comparator group was wholly inappropriate". Grasso himself set the "Chairman's Award", part of the Exchange's yearly performance score that the committee used to benchmark his pay. Each year he raised it above the empirical criteria, which "effectively increased the benchmark" for his own pay.
According to the Attorney General's complaint, Grasso's compensation and benefits for 2000 to 2002 equalled 99 per cent of the NYSE's net income. Net income in 2002 was $28 million. The Exchange's 27 August 2003 announcement disclosed a $139.5 million lump sum but left out $48 million in future payments, making a $187.5 million package. Grasso resigned at a board teleconference on 17 September 2003.
New York's Attorney General sued in 2004. In June 2008 the Court of Appeals upheld the dismissal of four claims, and in July 2008 the Appellate Division dismissed the remaining claims against Grasso because the NYSE's conversion to a for-profit company had ended the Attorney General's authority to pursue them. Grasso kept the $139.5 million. The claims fell on authority, not on their merits. The lesson here is the peer group, which set the starting point for each yearly award.
How to check the peer group before setting targets
The check has five parts, and it comes before any number is written into a plan.
- Find out who chose the peer group and on what written criteria. If no selection memo exists, record that as the first finding.
- Check each peer against the criteria that matter for this decision: size, business model, market, ownership and who pays for the service. Two organisations can share an industry code and differ on most of these.
- Re-run the key gaps against one alternative peer group that could be defended in front of the board. The aim is to see whether the gap holds, not to shop for a better answer.
- Write down the gap under both peer groups, which one the target will use, and why.
- Set the rule that this check happens before any gap becomes a target in the budget, the improvement plan or a pay decision.
Naming an alternative peer group is a way of reframing the problem. Here is what the record might have looked like for Grasso's pay in 2000. This is a reconstruction for illustration, using the figures in the Webb report. The committee did not run this check.
Peer group used: large, for-profit companies. Benchmark: $11.09 million. Award: $26.8 million, which is $15.71 million above the benchmark, or about 2.4 times it.
Alternative: an appropriate peer group. Reasonable level (Webb's conservative estimate): $4 million to $6 million. The same award is $20.8 million to $22.8 million above it, or about 4.5 to 6.7 times it.
Difference between the two starting points: $5.09 million to $7.09 million, before any award above the benchmark. Webb put the higher figure down to the peer group and to how the committee used the data. Written down, that difference would have needed a reason.
The same check applies to cost, service and headcount benchmarks. The Universal Decision-Making Method frames the decision before looking at the numbers, and the same order holds for data-driven decision-making in general.
The NYSE had a benchmark for its chairman's pay. What it didn't have was certainty that the companies in its comparator group were peers at all.
Work through your decisionNo sign-up. Just pick your decision and start.
Grant Purdy is the co-author, with Roger Estall, of Deciding (2020), and the architect of the Universal Decision-Making Method.