
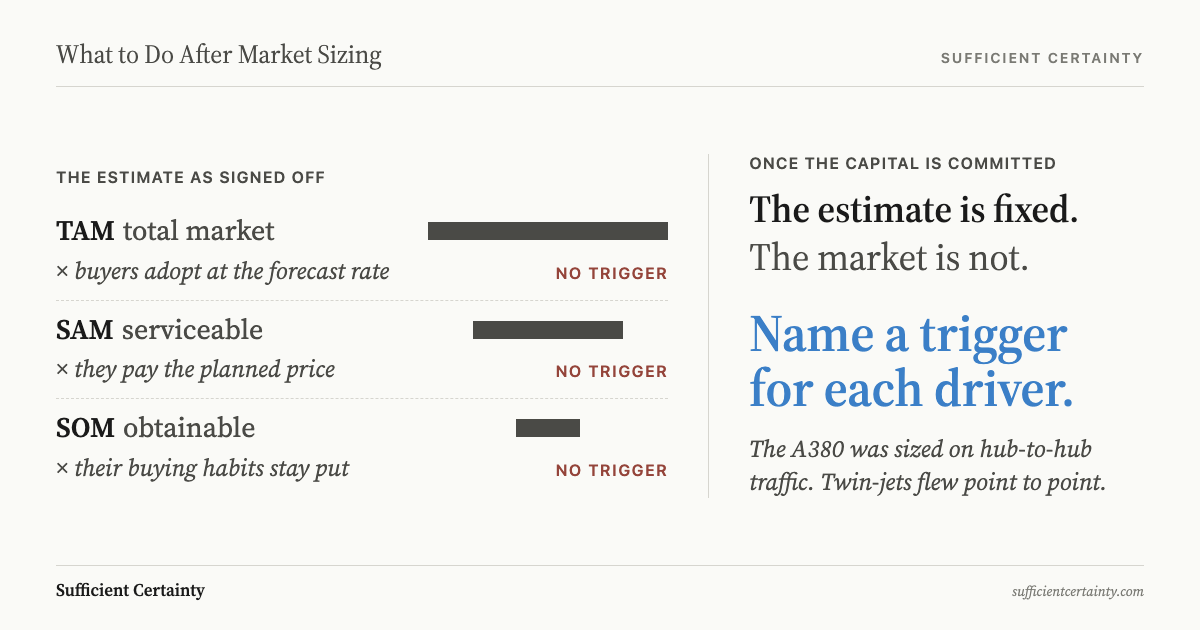
In a study of 210 transport infrastructure projects in 14 nations, Flyvbjerg, Skamris Holm and Buhl (2005) found rail passenger forecasts overestimated in nine projects out of ten, by 106 percent on average. The work that follows market sizing is to write down the drivers the number rests on, and the value at which each would change the decision it justified. The same study found that forecasts had not become more accurate over the 30 years it covered.
Market sizing estimates the customers, units or revenue a market could yield, usually expressed as total, serviceable and obtainable market (TAM, SAM, SOM).
Working down from TAM to a figure the business case can carry
The textbook sequence starts wide. Total addressable market is the whole demand for a category if every possible buyer bought. Serviceable addressable market narrows that to the segments, channels and regions the organisation can actually reach. Serviceable obtainable market is the share it can plausibly win within a planning horizon, against the rivals a competitive analysis has already mapped.
Analysts build the estimate two ways. Top-down starts from industry totals or analyst reports and cuts them by segment and region. Bottom-up starts from units: the number of target customers, times an adoption rate, times a price, times a purchase frequency. The inputs usually come from earlier market research, surveys and customer interviews.
Triangulation comes next. When the two methods land within a tolerable range of each other, the team settles on a figure, usually SOM, and moves it into the business case as the revenue line. From there it drives the capital request, the hiring plan and the investment memo. The estimate becomes the premise of a commitment.
By the time the memo reaches an investment committee, the model usually sits in an appendix and the headline figure sits on the first page.
A sized market turns an argument about ambition into arithmetic
Market sizing does real work. Before it, a proposal to enter a segment rests on enthusiasm. After it, the proposal carries a number that can be challenged, compared and priced. An obtainable market of a few million dollars and one of a few hundred million call for different organisations, different capital and different patience.
It also disciplines choices about growth, one of the earliest quantitative steps in strategic thinking. Whether a new segment or product is worth pursuing, the question the Ansoff matrix raises, is partly a question of size. A bottom-up model forces the team to name the customer, the price and the purchase cycle, which can then be tested against what rivals already charge and win.
Done well, the exercise makes the growth case falsifiable. Every input is visible and every input can be argued with. That visibility is also where its limit shows.
Write down the driver your market size depends on most and the value at which it would stop justifying the investment. Start the Walk →
A photograph of a market that keeps moving
A market-sizing model is a chain of multiplications. Customers, times adoption rate, times price, times frequency, less the share lost to substitutes. Each factor is a condition about the world: how many buyers will switch, what they will pay, how they will behave, what else they could buy instead. The output is one number, fixed on the day the inputs were gathered.
Multiplication compounds error. If three drivers each come in 20 percent above what turns out to be true, the product is not 20 percent high; it is about 73 percent high. Sensitivity analysis can show which driver moves the answer most, but it is usually run once, on the day the model is built.
The deeper problem is time. The conditions behind the number keep moving while the investment built on it is designed, funded and delivered. Adoption curves flatten or steepen. Price points erode. A substitute nobody modelled gets better. The number does not age visibly; the memo still says what it said on the day it was approved.
Nothing in the method says when to look again. TAM, SAM and SOM have no field for the value of a driver at which the decision would reverse, and no date or event that reopens it. The investment keeps drawing on a figure whose premises may have expired.
From hub-to-hub forecast to point-to-point market: the Airbus A380
In June 1999, Flight International reported Airbus's twenty-year forecast: 1,208 deliveries of passenger aircraft with more than 400 seats between 1999 and 2018. Boeing's forecast for the same category and period was 730. Both manufacturers were sizing the same market from the same traffic history.
The difference came down to one driver. Airbus expected the world's top 25 airports to absorb almost a third of capacity growth, and argued that as infrastructure filled up, airlines would have no alternative but to move to larger aircraft. Boeing read the trend the other way: long-haul markets were fragmenting, twin-jets were popular, and the average aircraft size in the global fleet had been falling for a decade.
Airbus launched the A380 in December 2000. Over the next two decades, long-range twins such as the Boeing 787 and Airbus's own A350 gave airlines a way to fly long routes with fewer seats per departure. Orders for the A380 never reached the scale the forecast implied.
On 14 February 2019, Emirates, the type's largest customer, cut its A380 order from 162 to 123, citing developments in aircraft and engine technologies, and ordered 40 A330-900s and 30 A350-900s. Airbus said deliveries would cease in 2021. Chief executive Tom Enders said there was "no substantial A380 backlog and hence no basis to sustain production." The 251st and final A380 went to Emirates on 16 December 2021.
Airbus's full-year 2018 results cited "the lack of order backlog with other airlines" as the reason, and recorded the cost of winding the program down.
The disagreement over that driver was public before launch. A forecast can carry the driver itself, written down: the share of long-haul traffic that stays concentrated at slot-constrained hubs, and the level of twin-jet range and orders at which the very-large-aircraft case weakens. A forecast gives one number, where scenario planning keeps the competing reading alive. A driver named in advance becomes a signal; one left inside the model arrives as a surprise.
Which signal should send the sizing back to the table?
Keep the number and add the triggers. The artefact is a driver register built from the sizing model itself: each driver, the value the model assumed, the value at which the decision would change, the signal that would show it moving, and who watches that signal. A threshold written before approval is harder to explain away after it.
The five-step Universal Decision-Making Method gives the register a sequence. Frame the decision the number serves: a launch, a plant, a market entry, not the market in the abstract. List the Tentative Elements, the options on the table, including a smaller first commitment. The Assumptions are the drivers: adoption rate, price point, customer behaviour and the performance of substitutes.
Sufficient Certainty sets how much confidence each commitment needs. A pilot needs less than tooling or a factory, so thresholds tighten as the stakes rise. Implement and Monitor turns the register into practice: each driver gets an owner and a named signal, such as a competitor's price, a conversion rate or a substitute's specification.
Two triggers reopen the decision. The first is scheduled: before each funding gate or major commitment, check every driver against its threshold. The second is event-driven: when a named signal crosses its threshold, the decision comes back, whatever the calendar says. That is what monitoring looks like when it is attached to a decision rather than a dashboard.
Market sizing answers how big the opportunity looked. The driver register answers when that answer stops holding.
Airbus had a market-sizing number big enough to launch the A380. What it did not have was a trigger to reopen that number once airlines started flying point to point.
Work through your decisionNo sign-up. Just pick your decision and start.
Grant Purdy is the co-author, with Roger Estall, of Deciding (2020), and the architect of the Universal Decision-Making Method.