
After a Wardley map, test the assumptions behind where each component sits on the evolution axis and how fast it is moving, before choosing what to build, buy or outsource. The map draws those judgments as positions, and positions read like facts. In 2001, one of America's two largest book chains decided its online store was a job for someone else, and gave it to Amazon.
A Wardley map plots the components that serve a user need by how visible each is to that user and how evolved it is, from genesis to commodity.
The textbook sequence after a Wardley map
Simon Wardley's method runs in a set order. A team anchors the map on a user need, lists the components that meet it, arranges them in a value chain from visible to invisible, then places each one on the evolution axis: genesis, custom-built, product, commodity. The finished map opens the strategic conversation. It does not close it.
The first move after mapping is to mark movement. Components drift rightward as competition makes them more common and better understood, so teams draw arrows showing where each is heading. Next come climatic patterns, the forces that act whatever anyone decides: everything evolves under supply and demand competition, commodities enable new higher-order activities, and past success breeds inertia.
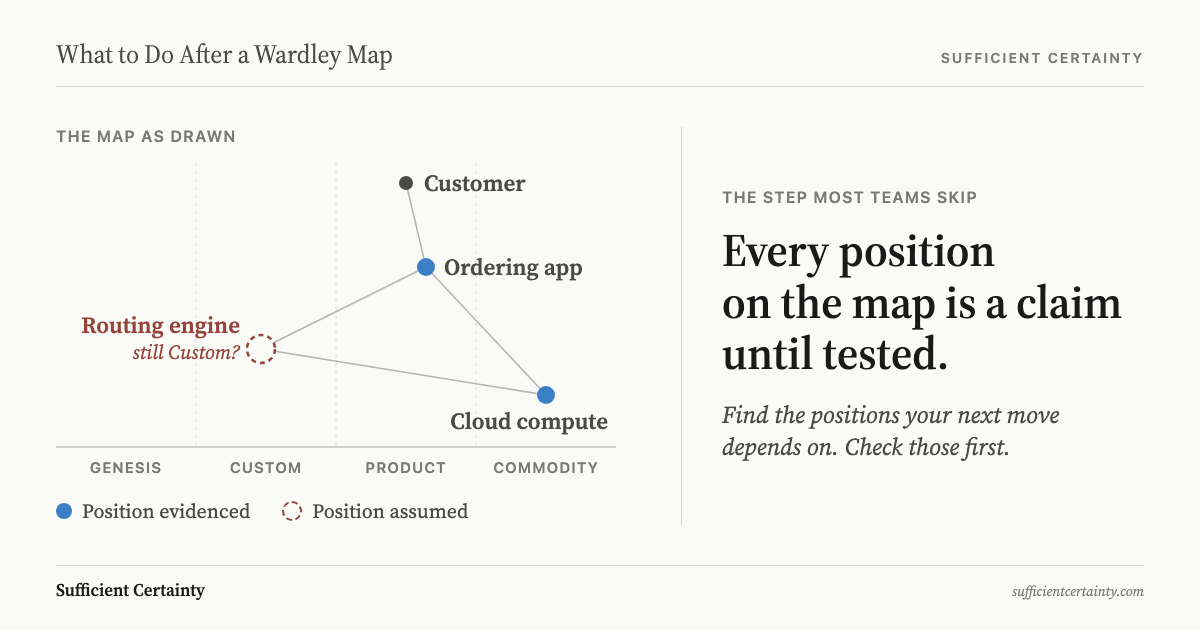
Then comes the build, buy or outsource logic, where stage decides method. Genesis and custom-built components get built in-house by small agile teams. Product components get bought off the shelf and run on lean lines. Commodities go to utility providers under tight contracts. Doctrine, principles such as knowing the users and using appropriate methods, governs how the organisation works. Gameplay covers deliberate moves, from open-sourcing a component to speed its evolution to building an ecosystem around a utility.
Last, the map gets shared. It is a communication tool as much as an analytical one, circulated so people can challenge each other's view of the landscape, much as the output of a competitor analysis gets circulated before a pricing call. Every step in this sequence treats the positions on the map as the ground the moves are built on.
The value in that sequence
The sequence does something most strategy tools do not. It forces a team to say what it actually depends on, component by component, in front of the people who fund it. Most strategy documents describe a destination without any picture of the ground in between. The map supplies the picture. A map exposes a strategy that was only ever a list of initiatives.
Stage-matched methods prevent an expensive and common error. Teams that custom-build commodities waste money. Teams that outsource genesis work under fixed-price contracts kill the exploration it needs. Wardley points to companies that still custom-build their own CRM systems despite near ubiquity. Matching method to stage is one of the few pieces of strategy advice that pays back at once.
The approach also travels well outside technology firms. At HS2, James Findlay used mapping from 2012 to compare each component's value to users against its commercial maturity, putting a novel building-information visualisation tool on the same page as utility compute. Non-technical stakeholders could follow the argument.
Like Five Forces analysis, a map describes the structure of a market. Unlike it, a map shows the organisation's own position inside that structure and how the structure is shifting. That is genuine strategic thinking. A map that gets argued over is worth more than a plan that merely gets approved.
Pick the component your build-or-buy call rests on and write down why it sits where it does on the evolution axis before anyone commits budget to it. Start the Walk →
The structural blind spot
Every position on a Wardley map is a judgment. The evolution axis has no units. Wardley is explicit that evolution cannot be measured over time and that the stages can only be described, so a team places each component by debating which description fits. He warns that this step is often the main cause of arguments in the group, and that teams tend to describe a component by how they treat it rather than how it should be treated.
The arguments end and the sticky notes stay. The map records the outcome of a negotiation in the same ink as everything else. A component placed at product after a ten-minute disagreement looks identical to one placed there on evidence. The map makes guesses look like geography.
Movement carries a second, larger assumption. The arrows say where a component is heading. They say little about when it arrives. Wardley himself writes that evolution cannot be anticipated over time or adoption, so the predictability of timing is low without weak signals, which is why anticipating disruption is its own discipline. Yet build, buy and outsource choices depend on timing. A component that will be a commodity in two years deserves a different decision from one that will take ten.
Gameplay chosen from the map inherits every placement and every speed estimate beneath it. This is the same gap that separates strategic thinking from strategic planning: one questions the landscape, the other executes on it. A move built on an untested position is a bet on the position, not a move on the board.
How Borders learned this
Borders never drew a Wardley map, but its most consequential decision turned on the placement question a map asks. On 11 April 2001, Borders Group and Amazon announced that Borders.com would relaunch on Amazon's platform, with Amazon as seller of record handling inventory, fulfilment, site content and customer service.
The rationale was stated plainly. Chief executive Greg Josefowicz said customers' online needs would be met "by the people who do it better than anyone else," while Borders concentrated on its stores. Borders.com had lost $29.7 million the previous fiscal year, which made the choice easy to defend. Read on a map, online bookselling had been placed as a mature, undifferentiated component, something to source from the best available supplier, well away from the user need Borders existed to serve.
Both placement and speed were wrong. In 2001 online bookselling sat nearer custom-built than commodity: one company was still working out how it should run, and that company was Amazon. It was also moving fast toward the centre of book buying. According to NPR's account of the collapse, Borders had already bet heavily on CDs and DVDs, and kept expanding and refurbishing stores rather than building its own online business. Barnes & Noble invested in online sales, then built the Nook e-reader.
Morningstar analyst Peter Wahlstrom described the Amazon deal as "more like handing the keys over to a direct competitor." Borders launched its own website in May 2008, seven years after the handover. Its last profitable year was 2006. It filed for bankruptcy in February 2011 and was liquidated that year, closing its remaining 400 or so stores; almost 11,000 employees lost their jobs. Outsourcing was not the chain's only mistake. It was the one that handed away the component its customers were moving toward.
Testing assumptions before committing resources
The answer is not a better map. It is a step between the map and the moves, and the five steps of the Universal Decision-Making Method supply it.
Frame the decision the map is meant to inform. Not what the landscape looks like, but whether a specific component should be built, bought or outsourced, and by when. Then set out the Tentative Elements: the proposed move and the alternatives it has to beat.
Next, the Assumptions. For each component the move depends on, write the placement and the speed as claims: online sales are a commodity; this will be a utility within three years. Record what evidence put each one there and what would move it. Surfacing assumptions this way turns sticky notes back into hypotheses.
Then decide what counts as Sufficient Certainty for this particular move. Outsourcing a genuinely commoditised component needs little proof. Outsourcing a component that customers may soon treat as the product needs far more. The cost of being wrong about a component's position should set how hard that position gets tested.
Implement and Monitor comes last. Name the signals that would show a component moving faster or slower than assumed, and review them on a fixed cadence, the same discipline that keeps a strategic gap analysis honest after the roadmap is funded. A map is a snapshot of beliefs, and monitoring is what shows when the beliefs have moved.
You could place every component on the map and still leave the assumption about how fast each one is evolving untested.
Work through your decisionNo sign-up. Just pick your decision and start.
Grant Purdy is the co-author, with Roger Estall, of Deciding (2020), and the architect of the Universal Decision-Making Method.