
After ROI analysis, most teams move straight to a go/no-go decision. The step they skip is testing whether the assumptions baked into the model reflect conditions that actually hold.
ROI analysis estimates the expected return on an investment relative to its cost, expressed as metrics like net present value, internal rate of return, or payback period.
The standard next step after ROI analysis
The textbook sequence runs on a single rail. ROI analysis produces a number. That number gets compared to a hurdle rate or ranked against competing projects, and the ranking drives a capital allocation decision.
In practice, the output is a recommendation deck. Finance teams build a discounted cash flow model, calculate net present value and internal rate of return, test a handful of scenarios, and present the result to a decision committee. Projects above the threshold get funded. Those below it wait or die. The entire approval process rests on the model's inputs being plausible, but the process itself rarely interrogates what "plausible" means.
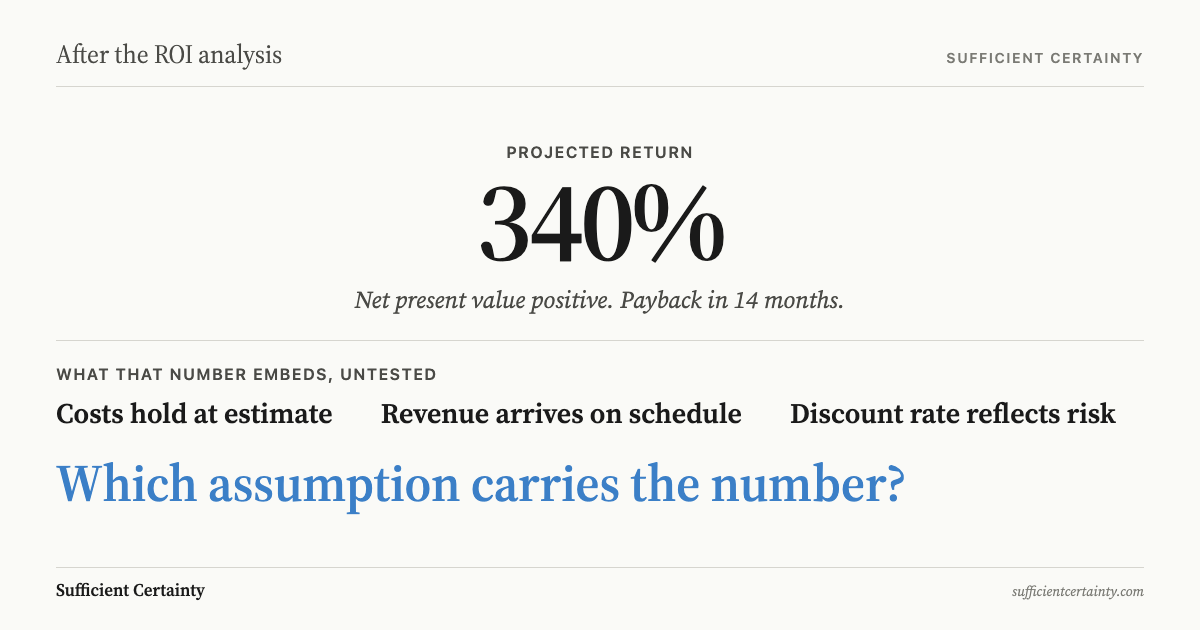
Most organisations add sensitivity analysis. They test what happens if revenue drops 10 per cent or costs rise 15 per cent. The purpose is to show that even under pessimistic conditions, the investment clears the hurdle. Boards expect this. Consultants deliver it. The cycle is familiar enough that it often runs on autopilot.
The output stack typically includes a base-case model, two or three sensitivity runs, a recommendation memo, and a summary slide deck. The decision committee reviews the numbers, asks questions about downside exposure, and votes. What it does not typically do is ask which inputs to the model are assumptions rather than facts.
What that step adds
The standard process adds genuine value. It imposes a common language for comparing investments that would otherwise be incommensurable. A warehouse expansion and a software migration look nothing alike until both are expressed as a net present value with a defined discount rate and time horizon.
It also introduces capital discipline. Without a hurdle rate, organisations fund projects on enthusiasm or politics. The requirement that a proposal must clear a quantitative threshold forces sponsors to articulate their revenue and cost assumptions in writing, where others can scrutinise them. As Kahneman and Lovallo (1993) noted, the discipline of making forecasts explicit is itself a partial check on the optimism that typically inflates them.
| What ROI analysis produced | What it assumed | Gap to test |
|---|---|---|
| Net present value (positive at 12% discount rate) | Discount rate reflects actual cost of capital for the full projection horizon | Whether funding conditions will hold across the project's life |
| Revenue projection (8% compound annual growth) | Current demand patterns and competitive landscape persist | Whether the addressable market has been validated outside the model |
| Payback period (3.2 years) | Operating costs remain within modelled range throughout | Whether cost inputs account for supply-chain, regulatory, or pricing shifts |
Sensitivity analysis extends this further. It answers a narrow but useful question: how much can a single input move before the project fails? That information is valuable. It identifies which variables carry the most leverage and focuses attention on the inputs with the highest consequence.
None of this is trivial. The issue is not that ROI analysis is wrong. The issue is that it is incomplete in a specific, predictable way, and the standard next step does not address the gap. Organisations that treat quantitative outputs as the full picture inherit the assumptions those outputs rest on, unexamined.
Write down the assumption your ROI model depends on most and ask whether anyone tested it before the number entered the approval deck. Start the Walk →
Where the standard playbook breaks down
ROI models break down not when the mathematics is wrong but when the inputs encode assumptions that nobody tests. Sensitivity analysis reveals that a project fails if revenue drops 30 per cent. It does not ask whether the revenue figure was defensible in the first place.
The Quaker Oats acquisition of Snapple is a case in point. Quaker paid $1.7 billion for the brand in late 1994. The ROI model rested on a central assumption: that Quaker could push Snapple through the same warehouse-to-supermarket distribution network that had made Gatorade a dominant force. The projected synergies justified the price.
The assumption was untested. Snapple's distribution ran through a network of independent distributors who serviced delis, petrol stations, and small retailers. These were relationship-driven operators, not warehouse logistics partners. Gatorade's distribution model was built for volume through large retail chains. The two systems had almost nothing in common.
Within months of the acquisition, Snapple's independent distributors began leaving. The brand's positioning, built on idiosyncratic advertising and grassroots loyalty, collapsed under Quaker's mass-market approach. Twenty-seven months after the acquisition, Quaker sold Snapple to Triarc Companies for approximately $300 million. Flyvbjerg, Holm, and Buhl (2002) documented this pattern across hundreds of major investments: project sponsors systematically overestimate benefits and underestimate costs because the assumptions underlying their forecasts go unexamined.
Every number in the Snapple ROI model was internally consistent. The discount rate was reasonable. The growth projections were arithmetically sound. The error was not computational. It was that the model's central premise, distribution synergy, was an assumption treated as a fact. No one in the approval chain tested whether Snapple's distribution network would actually accept the change. Assumptions embedded in analytical frameworks carry particular danger because the rigour of the surrounding analysis makes them look tested when they are not.
This pattern recurs beyond acquisitions. Flyvbjerg (2006) found that nine out of ten major infrastructure projects exceeded their budgets, with cost overruns averaging 28 per cent for roads, 45 per cent for rail, and over 50 per cent for dams and tunnels. The forecasts were not careless. They were built on assumptions about demand, regulation, and construction conditions that the analysts treated as given rather than as things to verify. Evidence-based practice requires distinguishing between data that has been verified and assumptions that have merely been modelled.
The step to take first
Before approving, rejecting, or ranking projects on the basis of ROI, identify which inputs are known facts and which are assumptions. This is not a philosophical exercise. It is a concrete sorting task that changes what happens next.
The five-step method treats this as the core of sound decision-making: frame the decision's purpose, name the tentative elements, surface the assumptions those elements rest on, determine whether certainty is sufficient to proceed, and only then implement with monitoring in place. Applied to ROI analysis, the third step, surfacing assumptions, asks a specific question of every material input: is this a measured value, or a projection that depends on conditions holding?
Revenue projections assume a market. Cost estimates assume a supply chain. Discount rates assume a funding environment. Sensitivity analysis tells the team which of these inputs matters most; assumption testing tells them whether those inputs have been verified or merely modelled. The distinction is the difference between a decision made under acknowledged uncertainty and one made under the illusion of precision.
None of this requires abandoning ROI analysis. The model is useful. The outputs are valuable. What changes is the question asked of the outputs. Instead of "does this clear the hurdle rate," the first question becomes "what are we assuming in order to get this number?" The approval decision still happens. It happens with the critical assumptions named, tested where possible, and monitored where they cannot yet be verified.
Data-driven decision-making does not mean accepting analytical outputs at face value. It means knowing which parts of the analysis are data and which parts are belief. ROI analysis produces a number. The number is only as reliable as the assumptions underneath it. Test those first.
You could close this tab and carry that decision into another week.
Work through your decisionNo sign-up. Just pick your decision and start.
Grant Purdy is the co-author, with Roger Estall, of Deciding (2020), and the architect of the Universal Decision-Making Method.