
In 1999 GEC let its defence electronics arm go to British Aerospace in a deal valued at about £7.7 billion, renamed itself Marconi, and paid $6.6 billion for two US telecoms equipment makers. What to do after a BCG matrix is to set how much certainty each move on it needs before a mature, cash-generating business is sold to fund a growth bet. Four years later, Marconi's old shareholders held 0.5% of the restructured company.
There is no public record that Marconi's board drew a growth-share chart. The move still reads as the chart's textbook prescription: exit the mature unit that throws off cash and concentrate the company's money on the fast-growing market. That makes it a clean test of what the matrix leaves out, and a hard lesson for any strategic thinking about a portfolio of businesses.
The BCG growth-share matrix, introduced by Bruce Henderson of Boston Consulting Group in 1970, plots business units by relative market share and market growth rate into four categories.
Marconi sold the cow and staked the company on a question mark
Through the 1990s GEC was a British conglomerate with defence electronics at its centre. At its peak, according to London Business School's account of the collapse, it had sales of £11 billion and a cash pile of £2 billion. Marconi Electronic Systems, the defence arm, held a leading position in a market that had stopped growing after the Cold War. In growth-share terms that is a cash cow: high share, slow growth, cash to spare.
Telecoms looked like the opposite. Carriers were spending heavily on network equipment, and any competitive analysis of the period would have placed GEC's telecoms business well behind Lucent, Nortel and Cisco. High growth, low relative share: a question mark. Henderson's 1970 essay is blunt about such units. They "almost always require far more cash than they can generate," and "if cash is not supplied, they fall behind and die." The prescription is to fund them into stars with cash from the cows.
The shape of Marconi's move matches. British Aerospace agreed in January 1999 to take the defence business, and the deal completed that November, creating BAE Systems. GEC renamed itself Marconi plc. In the same year it bought RELTEC for $2.1 billion and FORE Systems for $4.5 billion, and its 2003 annual report to the SEC lists both among its fiscal 2000 acquisitions. Marconi shares peaked at about £12 in the late summer of 2000.
The bet rested on one reading: that growth in carrier spending would continue. On 4 July 2001 Marconi issued a profit warning and its shares were suspended. When trading resumed they fell by more than half. The company's own filing later gave the reason. Operators' capital investment in the late 1990s had "proved unsustainable," alongside "overly optimistic expectations for demand growth." The bet on carrier spending was carrying the whole decision.
Revenue fell 34% in the year to March 2002, and the group wrote down almost £4 billion of long-lived assets. Executive director John Mayo resigned in July 2001. Lord Simpson, the chief executive, and chairman Sir Roger Hurn left that September. In May 2003 a scheme of arrangement swapped about £4.8 billion of creditor claims for cash, new notes and 99.5% of a new parent, Marconi Corporation. Old shareholders received 0.5% and warrants, and the filing described their Marconi plc shares as "effectively worthless."
The telecoms business could be written down, cut back and restructured, and it was. The defence business could not be bought back at any price. London Business School's account puts the market value destroyed at £37 billion in about a year and a half. Of all the moves Marconi made between 1999 and 2001, selling the cow was the one that could not be undone.
Pick the move your BCG matrix points to that could not be reversed, write down the market-growth figure it rests on and where that figure came from, and decide how sure you need to be before it reaches the board. Start the Walk →
Which axis on the matrix is a forecast in disguise?
The matrix earns its place. Henderson argued that "margins and cash generated are a function of market share" and that growth consumes cash to hold share. From those two ideas he drew a portfolio view: every company needs units that throw off cash and units worth investing it in. For a board that has been funding every division by habit, that is a useful shock, and a sound starting point for resource allocation.
It also compresses a sprawling group onto one page. Directors can see at a glance which units consume cash and which supply it, much as the Ansoff matrix lays out growth options. Few tools make the cash logic of a portfolio so visible, or so easy to argue about.
The trouble sits in the axes. Relative market share is a measurement: a unit's share divided by that of its largest rival, checkable against sales data. Market growth is different. It is a trailing rate, for a market someone chose to define, over a period someone chose to measure. A different market definition, or a different five years, can move a unit across the line. Plotted on the vertical axis, a record of the past becomes a claim about the future.
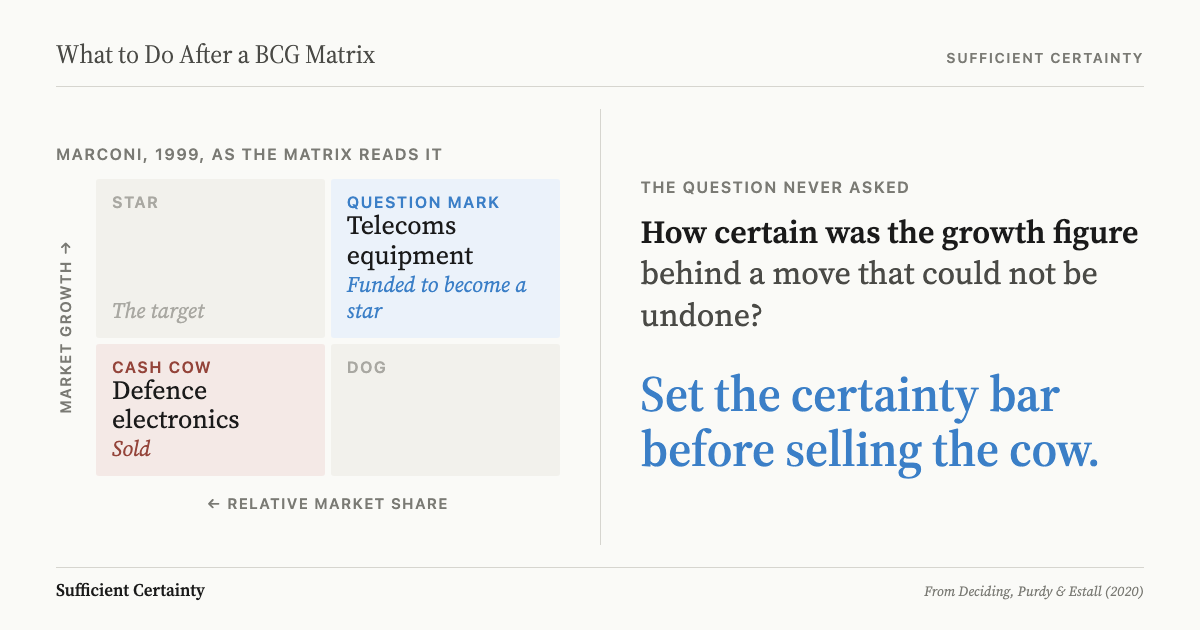
The labels then attach generic prescriptions: milk the cows, fund the question marks, divest the dogs (Henderson's original word was "pets"). None of them asks how certain the growth reading needs to be, or whether the move can be reversed. Relabelling a unit costs a slide. Selling one can cost the business. The grid below places Marconi's two businesses as they would have read in 1999, and where telecoms sat once carrier spending fell.
| High relative share | Low relative share | |
|---|---|---|
| High market growth | Star: where the funding was meant to take telecoms | Question mark: telecoms equipment in 1999, built up with RELTEC and FORE |
| Low market growth | Cash cow: defence electronics, sold to British Aerospace in 1999 | Telecoms equipment, 2001 Dog: where the question mark slid once carrier spending collapsed |
There is experimental evidence that the labels steer judgement. In a study of 1,015 subjects across six countries, Armstrong and Brodie (1994) found that information about the BCG matrix made people more likely to pick a clearly less profitable investment. Of those exposed to it, 64% chose the unprofitable project; of those who used it in their analysis, 87% did. The matrix sorts the portfolio but does not settle the bet.
Setting the certainty bar before selling the cow
The checkpoint belongs at a specific moment: before any divestment, acquisition or funding shift justified by a quadrant label goes to the board. The artefact to check is the evidence behind each circle. For every unit, write down the market-growth figure, its source and the period it covers, then the relative-share figure and the rival it is measured against. If nobody in the room can name the source or the period, the label has not yet earned the move.
Then rank the proposed moves by how hard they are to undo. Reclassifying a unit, trimming its budget for a year or running a pilot can all be reversed. Selling a cash cow or buying a would-be star usually cannot. A staged exit keeps an option open; a completed sale closes it. The certainty bar should rise with irreversibility, and a trailing growth rate on its own rarely clears the higher bar.
Closing that gap is ordinary decision-making under uncertainty. Ask what growth rate would have to hold, and for how long, for the move to pay. Look for evidence that does not come from the same trailing series: customer capital plans, order books, the finances of the carriers doing the buying. A growth strategy review can supply some of it. The method treats this as deciding what level of certainty is sufficient before committing.
If the evidence falls short, the options widen: stage the acquisition, keep the cow and fund the question mark more slowly, or set a monitoring trigger that returns the decision to the board when customer spending turns. A decision tool for boards can record which assumptions the recommendation rests on. Set the certainty bar before the cow is sold, because afterwards there is nothing left to decide.
How confident are you that the growth figure behind your question marks will hold long enough to justify giving up the cash cow?
Work through your decisionNo sign-up. Just pick your decision and start.
Grant Purdy is the co-author, with Roger Estall, of Deciding (2020), and the architect of the Universal Decision-Making Method.