
After an MVP launch, most teams move straight to the metrics dashboard. Signups, activation rates, retention curves, conversion. The step they skip is testing what those numbers actually assume about the market, the user, and the conditions under which the product was tested.
An MVP launch is the release of a product with just enough features to test whether it solves a real problem for paying users.
The standard next step after an MVP launch
The standard playbook runs on a single loop: build, measure, learn. The framework comes from Steve Blank's customer development method and was formalised as the Lean Startup methodology. It tells product teams to ship fast, instrument everything, and iterate on what users actually do rather than what anyone predicted they would do, whether in a business plan or a market research survey.
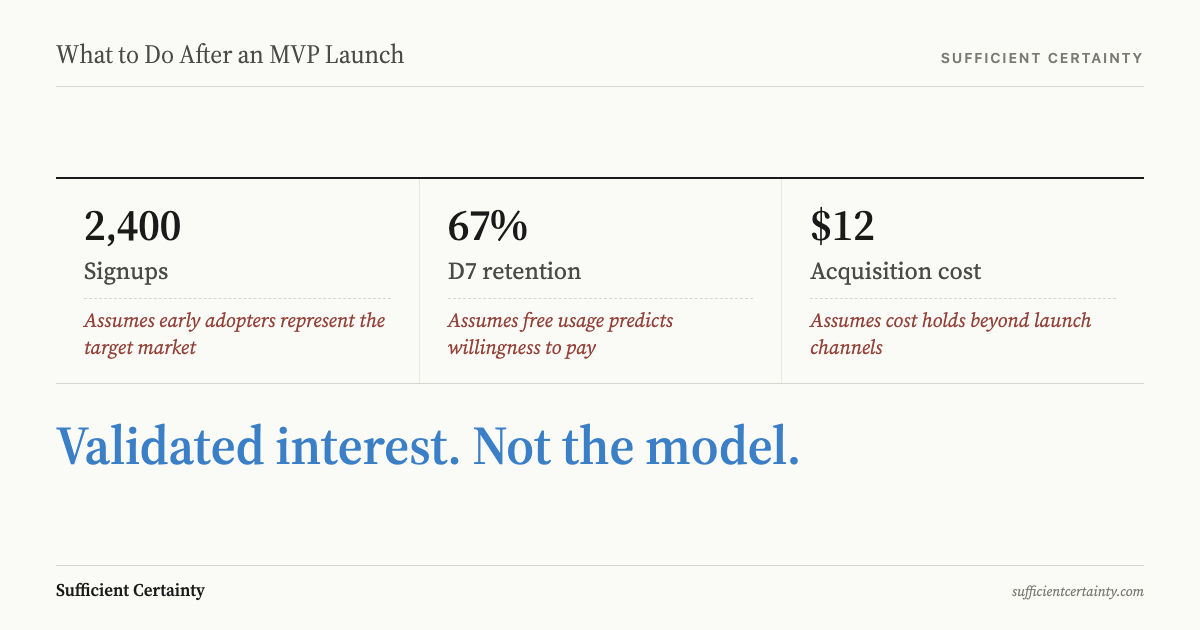
In practice, the first weeks after launch follow a predictable rhythm. The product team monitors acquisition: where users come from, what each costs to bring in, how many activate. The growth team watches retention: whether users come back at day one, day seven, day thirty. The revenue team tracks conversion: of the people who try the product, how many pay. These three signals form the core of what most post-MVP measurement looks like.
These metrics feed a prioritisation engine. Low retention triggers feature work. High acquisition cost triggers channel experiments. Low conversion triggers pricing or onboarding changes. The team ranks problems by impact, ships fixes, and measures again. The output is a backlog ordered by evidence rather than authority: features that users demonstrate they need, measured against the cost of building them, ranked by expected impact.
The best version of this loop also includes qualitative research. User interviews, session recordings, support ticket analysis. Teams that pair quantitative signals with direct user contact build a richer picture of behaviour and catch problems that metrics alone miss. The combination is what separates competent evidence-based decision-making from guessing. This is a disciplined, repeatable approach, and it is widely taught for good reason.
What that step adds
The build-measure-learn loop earns its reputation. Before this kind of thinking took hold, product teams spent months or years building in isolation, then launched to discover they had solved a problem nobody had. A CB Insights analysis of startup post-mortems found that "no market need" was the single most common cause of failure. The discipline of releasing early, measuring response, and iterating was a genuine advance.
Three things in particular make the standard approach valuable. First, it replaces speculation with observation. A team arguing about whether users want feature A or feature B can ship both as experiments and let usage data settle the question. Second, it creates accountability. When a team commits to moving a specific metric by a specific amount in a specific timeframe, progress becomes visible and failure becomes informative. Third, it compresses feedback loops. Instead of discovering a fatal flaw after two years of development, teams surface problems in weeks.
These are real gains, and any team that ignores user data and ships on conviction alone is building on sand. The metrics loop is a floor for decision quality, not a ceiling. But the loop has a boundary that most practitioners do not name. It measures what users do inside the product. It does not test the conditions that must hold for those measurements to mean what the team believes they mean. When those conditions shift, the result is good process producing bad outcomes.
Write down the assumption your strongest early metric depends on and ask who tested whether it will hold when you move past early adopters. Start the Walk →
Where the standard playbook breaks down
The build-measure-learn loop runs on a hidden layer of assumptions. Every metric carries presuppositions about the market, the user, and the conditions under which the product was tested. When those presuppositions hold, the loop works. When they do not, the loop produces confident conclusions from unreliable data.
Consider what a strong retention number actually assumes. It assumes the users who signed up are representative of the broader market, not just early adopters with a higher tolerance for unfinished products. It assumes the problem the product solves is durable, not seasonal or tied to a temporary condition. It assumes competitors will not replicate the core value before the team can build a defensible position. None of these assumptions appear on a metrics dashboard. They sit beneath it.
| What MVP metrics produced | What it assumed | Gap to test |
|---|---|---|
| Product-market fit signal (retention curve) | Early users represent the target market at scale | Compare early-cohort demographics and behaviour with the intended mass-market profile |
| Revenue model validation (conversion rate) | Price tolerance holds beyond early adopters | Survey non-converters on willingness to pay; test alternative price points before committing to one |
| Channel economics (CAC payback period) | Acquisition costs stay stable as volume grows | Model channel saturation curves and identify the ceiling on each primary acquisition source |
| User satisfaction (NPS or CSAT) | Respondents represent all segments, not just the most engaged | Compare survey response rates against overall user base; weight satisfaction scores by usage level |
Quibi illustrates the cost of skipping this layer. The short-form streaming platform, founded by Jeffrey Katzenberg and led by CEO Meg Whitman, raised $1.75 billion before its April 2020 launch. Early download numbers were strong. The product functioned as designed. The content pipeline featured productions from established Hollywood talent. By internal metrics, the launch was executing to plan.
But the metrics rested on assumptions the team never examined as assumptions. They assumed mobile users wanted premium short-form content during commutes and in waiting rooms. They assumed content quality was the bottleneck, and that viewers would pay $5 to $8 per month for a mobile-only experience when free alternatives like TikTok and YouTube already filled the same time slot. They assumed the viewing context (short waits, transit) was a durable use case rather than one that could disappear overnight.
Six months after launch, Quibi shut down. Katzenberg attributed part of the failure to COVID-19, but investor commentary and reporting pointed to something more fundamental: the core value proposition had not been validated at the assumption level. The downloads were real. The engagement was trackable. But those numbers measured behaviour inside a product whose reason for existing had never been tested against the conditions it required. This is a pattern that overconfidence bias makes difficult to see from inside the team. It is not a failure of execution. It is a failure of assumption management.
The step to take first
The missing step is not more metrics. It is a structured pass through the assumptions behind the metrics, conducted before the team commits resources to scaling.
The five-step method used in structured decision practice offers a direct way to do this.
Frame the decision. After an MVP launch, the real decision is not "which feature to build next." It is "should this team invest further in this product, and under what conditions." Framing the problem this way lifts the conversation from product tactics to the question that actually determines whether money and time get spent well.
Name the tentative elements. List what the team believes it knows: the target user, the core value proposition, the acquisition channels that work, the price point that converts. Each element is tentative until verified outside the controlled conditions of an early launch.
Surface the assumptions. For each element, name what must remain true for it to hold. The retention rate assumes representative users. The conversion rate assumes willingness to pay at scale, not just early-adopter tolerance. The acquisition cost assumes channels that do not degrade with volume.
Determine sufficient certainty. Not every assumption needs exhaustive testing. The discipline is identifying which assumptions carry the most consequence: if this one is wrong, does the entire investment case collapse? Those assumptions need evidence before capital gets committed. This is what distinguishes making decisions with uncertainty from making decisions in ignorance of what is uncertain.
Implement and monitor. Build the monitoring into the decision before scaling begins. Which signals would tell the team that a critical assumption has broken? What will they do when those signals appear? A decision made without a monitoring plan is not a decision. It is a hope.
This sequence does not replace the build-measure-learn loop. It sits underneath it, testing the foundation before the team builds higher. The difference between a product that scales and one that scales into failure is rarely the speed of iteration. It is whether anyone tested what the iterations assumed.
You could close this tab and carry that decision into another week.
Work through your decisionNo sign-up. Just pick your decision and start.
Grant Purdy is the co-author, with Roger Estall, of Deciding (2020), and the architect of the Universal Decision-Making Method.