
After a cost-benefit analysis, and before anyone commits, find the forecast the answer depends on most and decide how sure you need to be of it. A benefit-cost ratio above one says the project works if the forecast holds. It cannot say how likely that is.
Across more than 100 privately financed toll roads, first-year traffic averaged about 77 per cent of what the forecasts had promised, according to Bain (2009).
Cost-benefit analysis values a proposal's costs and benefits in money over time, then compares them as a net present value or a benefit-cost ratio.
The Cross City Tunnel and the traffic that stayed on paper
Sydney's Cross City Tunnel runs 2.1 kilometres under the city centre, between Darling Harbour and Kings Cross. The Roads and Traffic Authority (RTA) signed the project deed with CrossCity Motorway (CCM) in December 2002. The government's condition was "no net cost to government", so CCM would finance, build and run the tunnel and recover its money from tolls. It won largely by offering the highest upfront payment, just under $97 million by contract signing, on a project the Auditor-General later costed at $680 million.
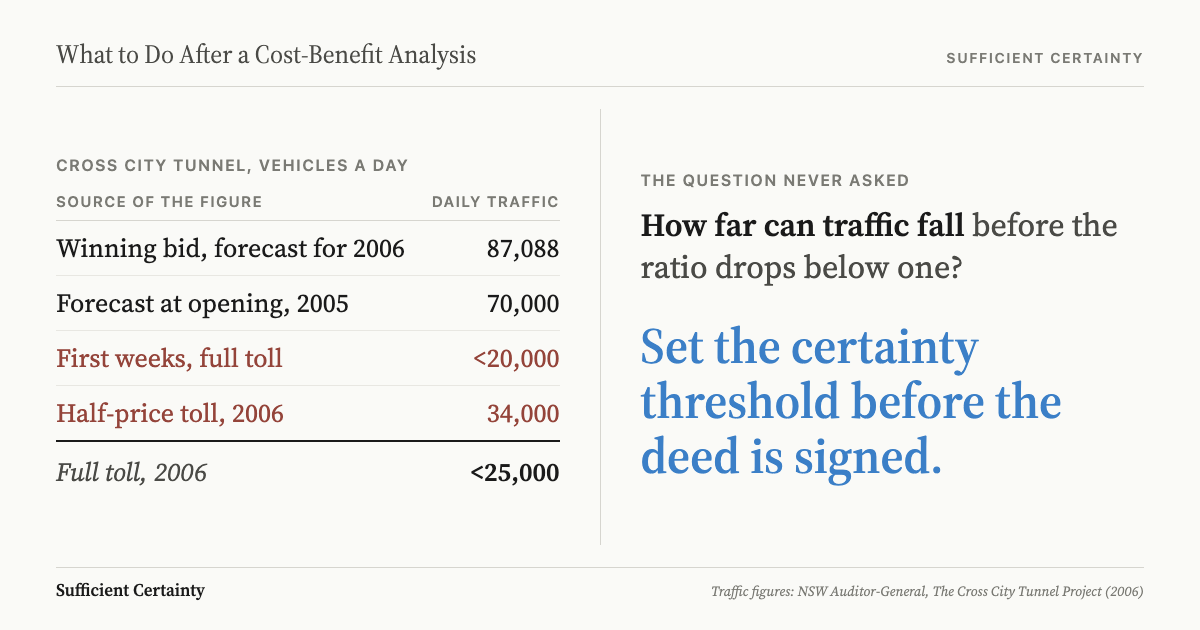
Almost everything rested on one line in the forecast. CCM projected 87,088 vehicles a day by June 2006, and the RTA's own benchmark was 82,347. The audit noted a close link between a bidder's patronage projections and the upfront payment it could offer.
The RTA and the Department of Planning relied on estimates of more than 80,000 vehicles a day when they decided to change surface roads straight away, a package that grew to 73 road changes. The public benefit and the private revenue sat on the same number.
The bids carried warnings. Two of the three private bidders thought the project was not financially viable without significant government funding. CCM's projections for 2006 ran 12 to 50 per cent above its rivals'. The differences, the Auditor-General's 2006 performance audit found, "were so significant that the assessment panel should have seriously questioned the viability of all the CCM bids." The RTA replied that every bidder's model had been stress tested against much lower revenue, and CCM's performed well.
The tunnel opened in August 2005 with a toll of $3.56. In its first weeks it carried fewer than 20,000 vehicles a day, against about 70,000 forecast for opening. A toll-free period followed from October 2005, then a half-price toll from March 2006 lifted average use to 34,000. At full price it averaged fewer than 25,000, less than a third of the forecast. By December 2005, anger over the toll and the road alterations had produced a parliamentary inquiry.
The operating company went into receivership in December 2006, less than 18 months after opening. When the receivers sold the tunnel in June 2007 to a consortium led by ABN Amro and Leighton Contractors for about $700 million, the lending banks were to be repaid in full. The equity investors, CKI, Deutsche Bank and Westpac, expected back between 10 and 20 cents in the dollar.
Taxpayers did not carry the traffic risk. The Joint Select Committee's first report accepted that patronage risk had passed to CCM, but found that "the political risk has arguably remained with the Government." Motorists and residents inherited surface roads redesigned for traffic that never went underground. A forecast that clears every stress test can still reflect overconfidence nobody measured.
What does a benefit-cost ratio actually prove?
Cost-benefit analysis does real work. It puts a proposal into one currency, sets costs paid now against benefits that arrive over decades, and discounts both to a present value. The same discounting drives an NPV analysis. Of the decision-making frameworks used in public investment, it is the one that lets a treasury compare a tunnel with a hospital wing on common terms, and it forces sponsors to write their numbers down where others can challenge them.
When outcomes stay in their original units, the follow-up to a cost-effectiveness analysis checks each option against its actual comparator.
Good practice goes further than the base case. The UK Treasury's Green Book guidance on optimism bias tells appraisers to adjust "estimates of a project's costs, benefits and duration" using data from past or similar projects. Most business cases also include a sensitivity analysis, flexing demand, cost and discount rate to show the ratio survives some pressure.
Every figure on those cards is conditional. The ratio says the project is worth doing if its inputs hold. It is silent on how likely they are to hold, and on how likely they need to be. A ratio of 1.3 resting on a forecast with decades of comparable data behind it is a different proposition from the same ratio resting on a new kind of asset in a new market.
Sensitivity analysis gets closer but answers a narrower question. It reports what happens if demand falls 20 per cent. It does not say whether a 20 per cent fall is remote or close to certain, and Bain's average shortfall was 23 per cent. CCM's bid performed well in the RTA's stress tests, and traffic at full toll still came in under a third of forecast. Surviving a test is not the same as clearing a threshold.
Take the one forecast your benefit-cost ratio leans on, work out how far it can fall before the ratio drops below one, and decide how sure you need to be of it before anything is signed. Start the Walk →
From base case to certainty threshold
The checkpoint sits after the analysis is complete and before the concession deed, funding approval or contract is signed. The check after capital budgeting also tests whether the selected projects can be funded in a workable sequence. A break-even analysis also needs achievable sales volume and cost behaviour checked before fixed spending is committed. It needs one artefact: the forecast line that carries most of the benefit side. For a toll road that is daily traffic. It is the input whose error would do the most damage to the ratio.
Then work out how far that line can fall before the ratio drops below one. Appraisers call this a switching value. Take a ratio of 1.3 whose benefits scale with traffic. It falls below one if traffic comes in about 23 per cent under forecast, which is Bain's average first-year miss. The comfortable margin is the typical error.
- A benefit-cost ratio above one at forecast traffic
- A preferred bid that passes the stress test
- The traffic shortfall that pushes the ratio below one
- How far apart the bidders' forecasts sit
- Who carries the loss if traffic misses
- Road changes committed on the same traffic number
The threshold follows from the switching value. The forecast has to be trusted at least down to the level where the ratio hits one, and the evidence has to show that a miss that large is unlikely. In Sydney the same traffic line carried a 30-year concession and 73 road changes at once, so the bar sits well above an even chance. Set the threshold before the evidence arrives, so the answer cannot bend it.
Then test the forecast against it. Use reference-class data such as Bain's, the spread between competing bidders, and a range from the forecaster rather than a point. The Auditor-General recommended the last of these: consultants should give "a clearly defined range of likely patronage outcomes," and approval should weigh viability across that range. This is scenario thinking rather than forecasting applied to one number.
A forecast that misses the bar does not end the project by default. The board can cut the scope, shift the demand risk, build in phases, or decline. That is what it means to challenge a business case before approval.
In the Universal Decision-Making Method, sufficient certainty is judged after the analysis is done, never folded into it. The separation matters most in decisions under uncertainty, where the forecast cannot be checked until the money is spent. Agree the threshold before the deed, not after the traffic counts arrive.
How confident are you that the forecast behind your benefit-cost ratio could miss by a quarter and still leave the ratio above one?
Work through your decisionNo sign-up. Just pick your decision and start.
Grant Purdy is the co-author, with Roger Estall, of Deciding (2020), and the architect of the Universal Decision-Making Method.